Arbitrum falls 7.2% while Ondo rises 6.1% in the same 24 hours
Arbitrum fell 7.23% and Ondo rose 6.13% in the same Coinbase dollar window. A five-minute timeline shows how the 13.36-point gap opened.
Published
On this page
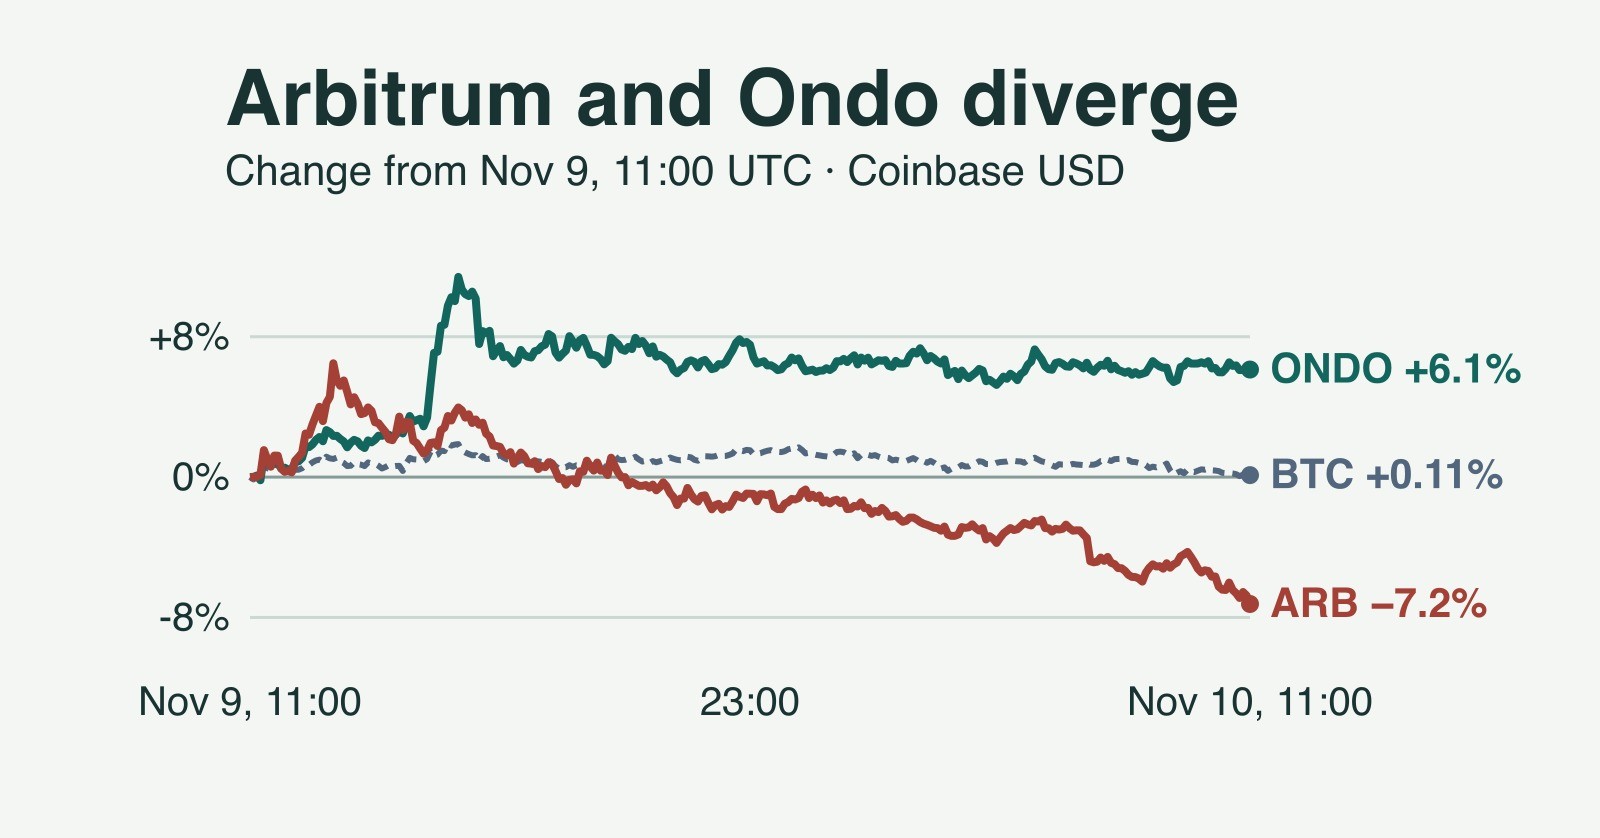
Arbitrum fell 7.23% to $0.16404 while Ondo rose 6.13% to $0.37140 in the 24 hours through 11:00 UTC on November 10, 2026, according to Coinbase historical dollar observations for ARB and ONDO. Bitcoin gained 0.11% over the same window. The two tokens finished 13.36 percentage points apart, even though Arbitrum led by 4.14 points two hours into the comparison.
The reversal is the useful part of the comparison. By 16:00 UTC on November 9, both tokens were still above their starting prices, but Ondo had already built a lead of 7.44 points. That lead later widened as Arbitrum gave up its gain and fell below its starting price. The final 24-hour figures show the split; the price path shows when it took shape.
Arbitrum led the first leg
Arbitrum started the window at $0.17683, using the 11:00 UTC observation in Coinbase’s weekly ARB history. At 13:00 UTC its price reached $0.188295, a 6.48% gain and the highest five-minute observation in the window. Ondo had gained 2.35% by then, from $0.34995 in Coinbase’s weekly ONDO history to $0.35816.
That early lead was brief. At 14:20 UTC, Ondo was first ahead on the sampled grid after Arbitrum’s 13:00 high, by about a quarter of a percentage point. By 16:00 UTC Ondo had reached $0.38987, its highest sampled price in the comparison and 11.41% above its baseline. Arbitrum was still up 3.97% at that point. The reversal in leadership therefore showed up before Arbitrum turned negative against the 11:00 baseline.
The distinction matters if you saw both tokens rising on Monday. A price can still be up on the day while losing ground against another asset. Comparing the two at the same times shows how an afternoon that began with Arbitrum in front ended with Ondo far ahead, without assuming the two tokens were responding to the same news.
How the 13.36-point gap opened
These checkpoints express each token’s change from its own November 9, 11:00 UTC dollar observation. A positive gap means Ondo was ahead. Figures are rounded independently; the gaps use the unrounded returns.
November 9, 13:00 UTC: Arbitrum +6.48%, Ondo +2.35%. Arbitrum led by 4.14 percentage points.
November 9, 16:00 UTC: Arbitrum +3.97%, Ondo +11.41%. Ondo led by 7.44 points.
November 9, 23:00 UTC: Arbitrum −0.95%, Ondo +7.54%. Ondo led by 8.49 points.
November 10, 05:00 UTC: Arbitrum −3.46%, Ondo +5.47%. Ondo led by 8.93 points.
November 10, 11:00 UTC: Arbitrum −7.23%, Ondo +6.13%. Ondo led by 13.36 points.
From Arbitrum’s high at 13:00 to Ondo’s high at 16:00, the gap swung 11.58 percentage points in Ondo’s favor. Ondo gained against its baseline over that stretch while Arbitrum’s gain shrank. By contrast, from 16:00 to 23:00 both tokens lost ground against their starting values. Ondo still widened its lead by 1.05 points because Arbitrum gave up more of its normalized gain.
The final six hours widened the gap by another 4.43 points, from 8.93 to 13.36. Over those six hours, Arbitrum moved from $0.170705 to $0.16404 while Ondo rose from $0.369075 to $0.37140. The gap reached its widest sampled value at the end of the window. That says where the comparison ended, rather than how wide the gap became afterward.
Ondo gave back part of its gain, too
Ondo’s 6.13% gain measures its move from the start of the window. It was below its own high at the endpoint. The increase from $0.34995 to $0.38987 was $0.03992 per token; by 11:00 UTC the remaining increase was $0.02145. Dividing the remaining gain by the earlier rise gives 53.73%. Ondo kept just over half of its sampled dollar gain.
Arbitrum finished 12.88% below its $0.188295 sampled high. That percentage uses the high as its denominator, whereas the headline’s 7.23% loss uses the previous day’s 11:00 UTC price. Both calculations end at $0.16404. The peak comparison describes the reversal someone would have seen from the top of the sampled move; the 24-hour comparison gives both tokens the same starting clock.
The last hour adds another qualification: both prices fell from 10:00 to 11:00 UTC. Arbitrum fell 1.99% and Ondo fell 0.44%. Ondo’s lead widened during that hour even as its own price declined. A widening gap tells you which asset held up better over an interval; the sign of each individual return tells you whether either actually rose.
The last 15 minutes show why it helps to keep those intervals separate. Arbitrum was down 0.37% over that period but fell 0.52% in the last five minutes alone. The five-minute drop was larger because Arbitrum had risen from $0.16465 at 10:45 UTC to $0.16490 at 10:55 UTC before turning down again. Ondo was up 0.03% over the last 15 minutes, close to flat at this precision. Neither short window replaces the matched 24-hour comparison.
What the comparison says about the wider market
Coinbase’s weekly Bitcoin history gives a starting price of $74,050.085. Its five-minute Bitcoin history shows $74,132.555 at the end, a 0.11% increase. Bitcoin also climbed during the window, reaching $75,467.615 at 15:45 UTC before surrendering most of that gain. Its near-flat 24-hour result describes its endpoints, not a flat intraday chart.
Bitcoin gives the comparison a familiar reference, though it cannot represent every crypto market. All three series show some gains on November 9 before retreating from their sampled highs. It cannot, by itself, tell us why one token ended well above its starting value and the other well below. Nor can price data establish whether money moved directly from Arbitrum to Ondo. That would require evidence about actual flows and participants beyond these quote histories.
The comparison is about the ARB and ONDO tokens. It does not measure usage on Arbitrum’s network or returns on products offered through Ondo. Those are separate questions. Matching the observation times helps isolate the price divergence without turning it into a claim about the projects’ business or technical performance.
How we matched the observations
For each asset, we used the 11:00 UTC sample on November 9 as the baseline. The weekly history supplies that starting sample; the day history supplies the next five-minute observation through 11:00 UTC on November 10. That gives 289 matched observations per asset, including both endpoints. The day and week histories agreed on all 43 shared timestamps for each of the three assets in the retrieved datasets. These are two views from the same provider, so that overlap checks consistency, not independence.
We divided each change in dollars by that asset’s own starting price. We then subtracted Arbitrum’s unrounded return from Ondo’s to measure the gap in percentage points. Normalizing the chart this way makes a fraction of a cent on ARB comparable to a different dollar move on ONDO without implying that the tokens have comparable supplies or market values.
We also moved both endpoints back half an hour and used the 10:30 UTC observations on both dates. Over that alternative 24-hour window, Arbitrum fell 6.76%, Ondo rose 5.85% and Bitcoin gained 0.06%. The Ondo–Arbitrum gap was 12.62 percentage points. That earlier cutoff gives a smaller gap, but the direction of each move and the broad size of the split are the same. This checks how much the conclusion depends on the last half hour rather than assuming the final 11:00 observation is representative of every cutoff.
The values are indicative historical observations, not prices guaranteed for any order. The sampled highs and lows can miss moves between observations, and a later start or end time would give different returns. This is a fixed historical window, with no claim about what prices are doing now or what either token will do next.
Send a correction or source question about this article.
Related Posts
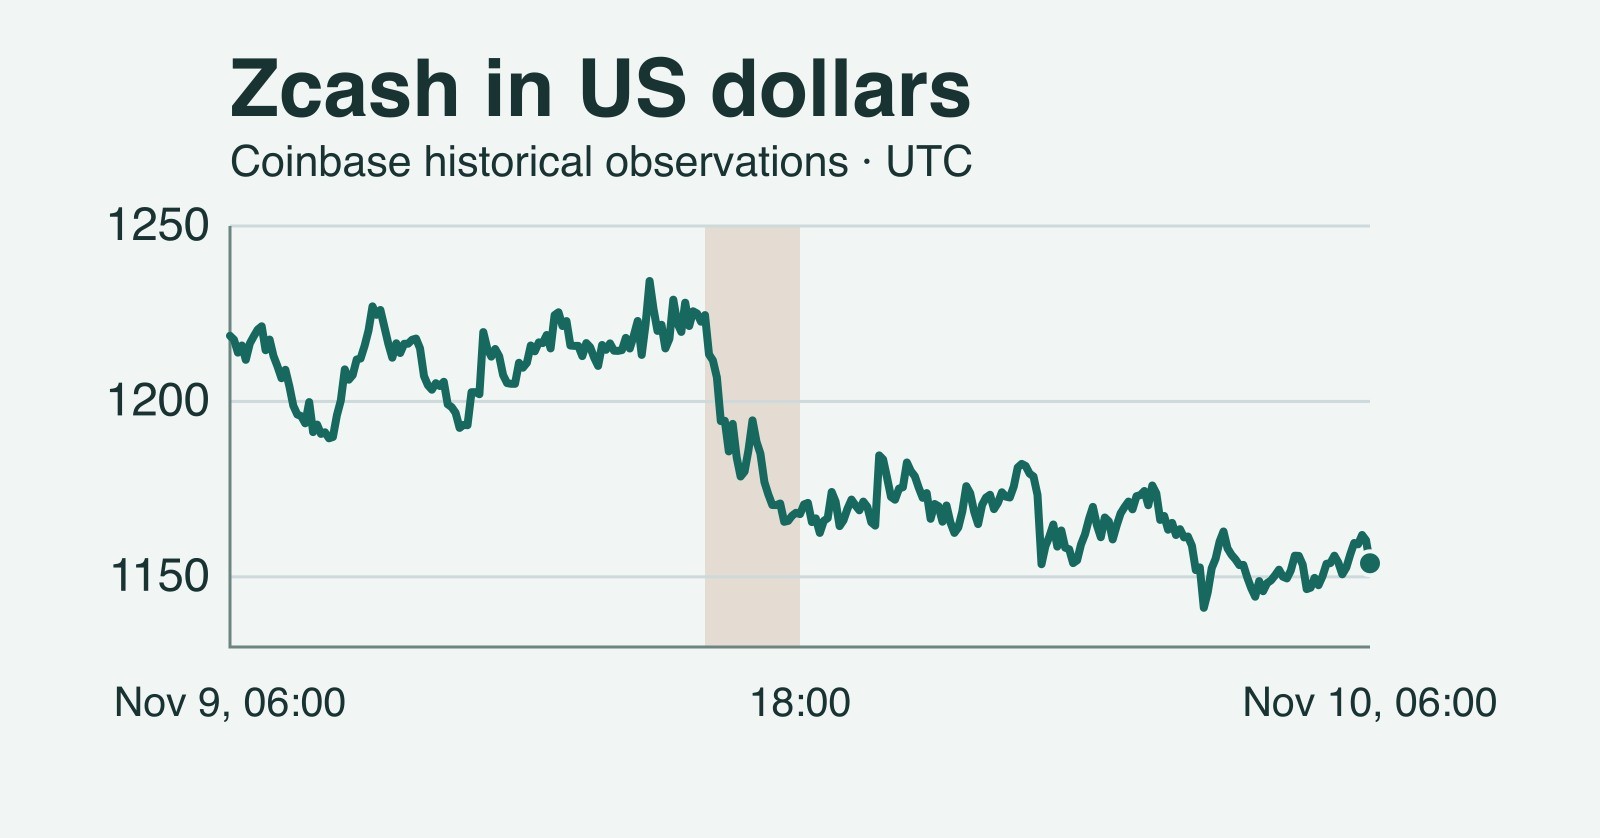
Zcash falls 5.3% in 24 hours, with most of the drop in two hours
Coinbase dollar observations put ZEC at $1,153.87 after a 5.32% decline. Two hours explain most of the loss, while Bitcoin edged higher on the same clock.
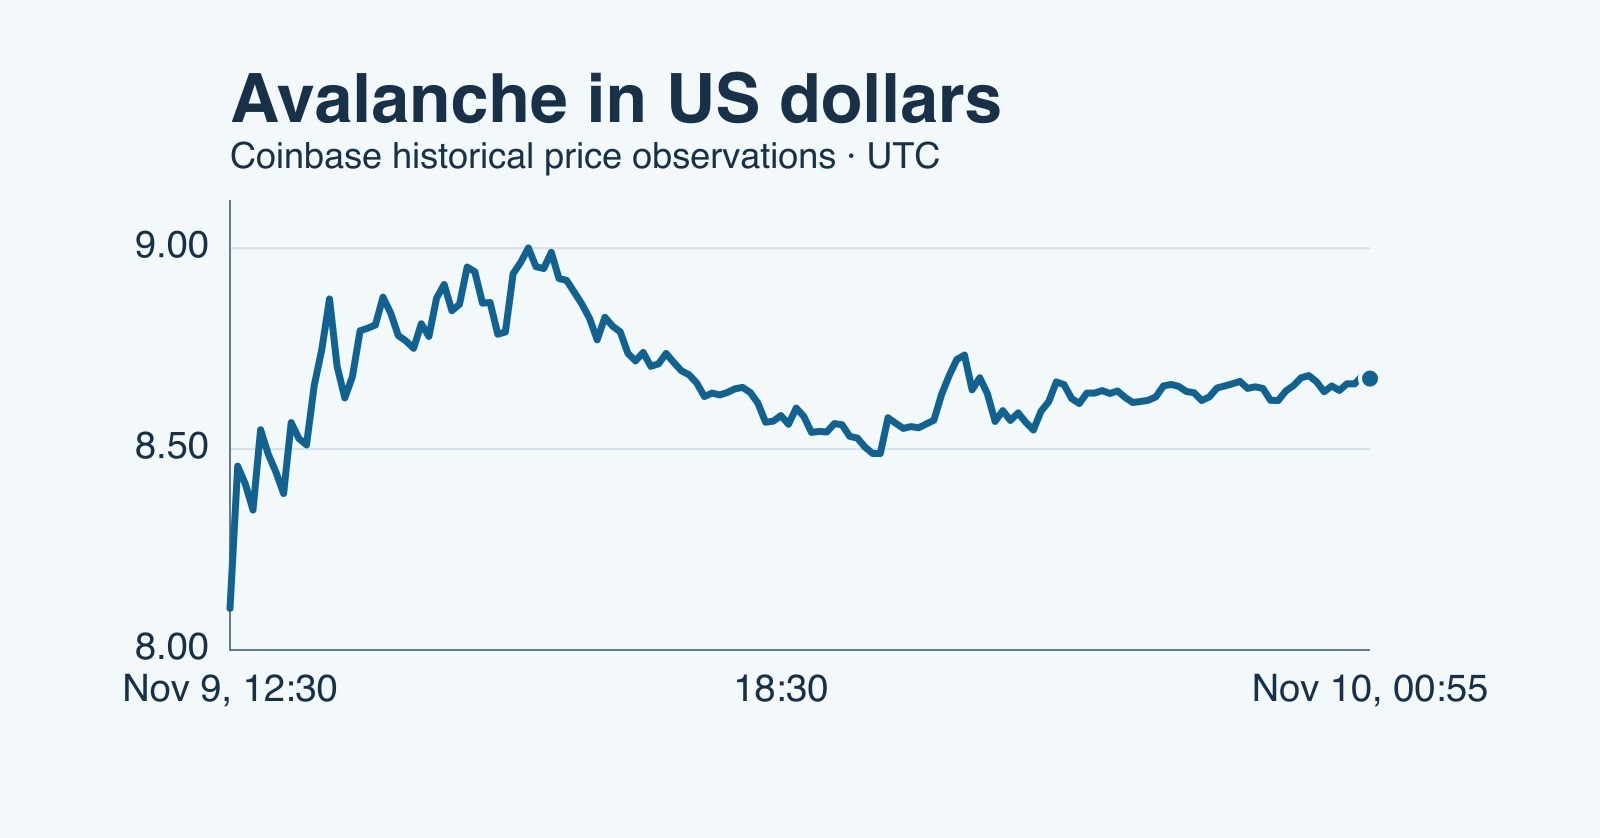
Avalanche rises 9% in 24 hours and keeps most of its rally
AVAX gained 9.07% in a matched 24-hour dollar window. Five-minute data show how much of the November 9 surge held after the price briefly touched $9.

Bitcoin dips below $77,000; rebound recovers 29% of sampled decline
Coinbase’s sampled BTC-USD price fell 6.80% from its October 29 high. A rebound to $77,933.80 recovered only 29% of that drop; our timeline separates the measurements.