Avalanche rises 9% in 24 hours and keeps most of its rally
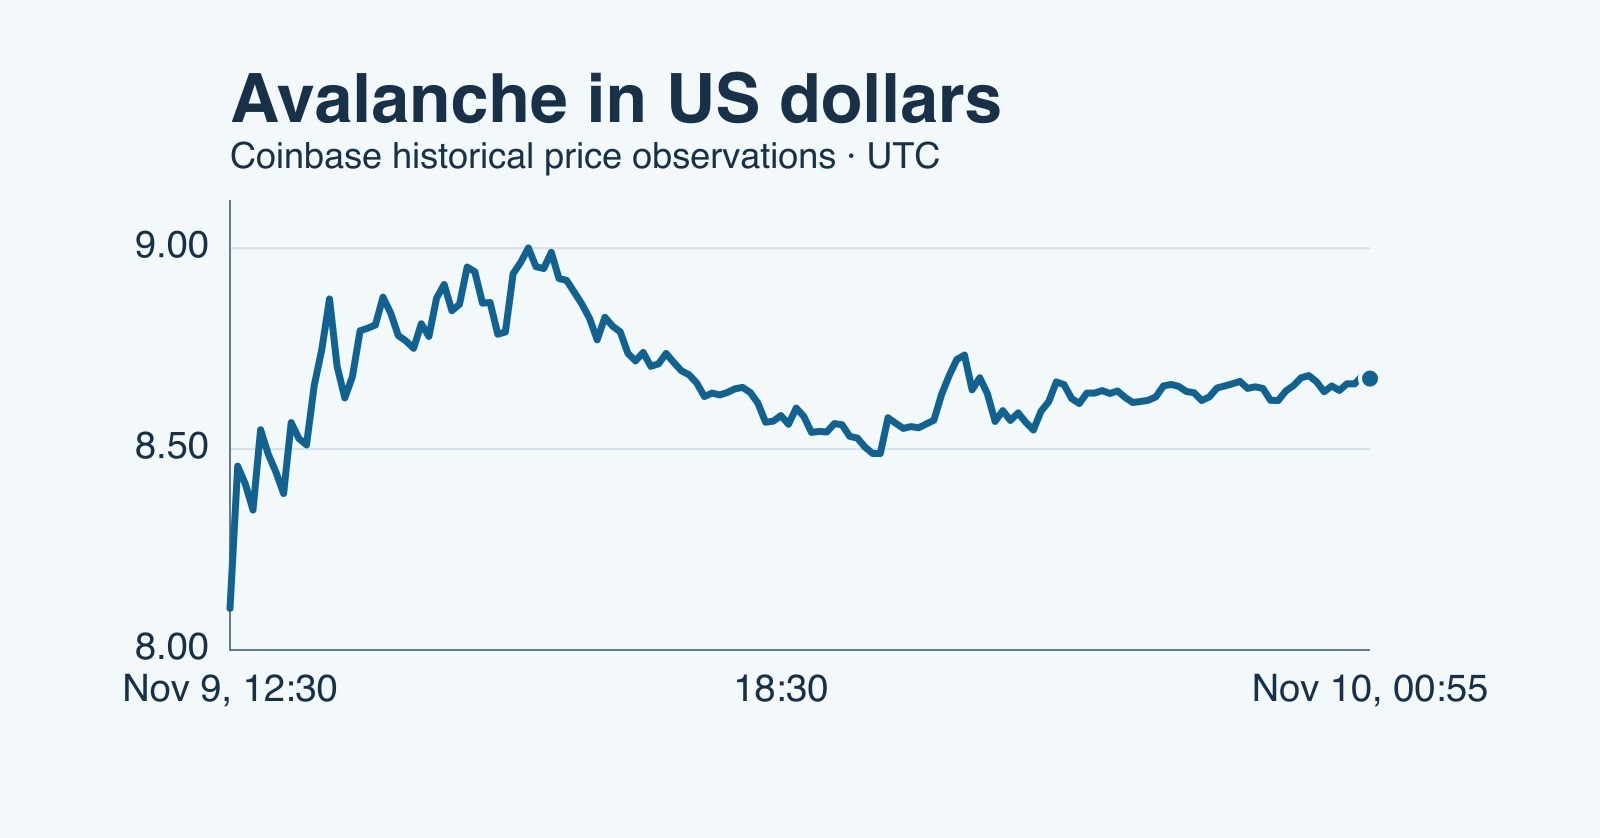
AVAX gained 9.07% in a matched 24-hour dollar window. Five-minute data show how much of the November 9 surge held after the price briefly touched $9.
Published
On this page
Avalanche’s AVAX rose 9.07% against the US dollar in the 24 hours to 00:00 UTC on November 10, according to Coinbase’s AVAX history. A separate look at the November 9 surge shows how much survived the pullback. By 00:55 UTC, AVAX had kept about 64% of the dollar gain from its pre-jump observation to its sampled high.
The two measurements answer different questions. The midnight-to-midnight change shows how AVAX performed over a full day. The 64% figure measures how much of the move from $8.1035 at 12:30 UTC on November 9 to $9.0005 at 15:45 remained at the later $8.6755 observation. That distinction matters when a strong 24-hour gain sits alongside an evening retreat.
The rally built in bursts
Coinbase’s intraday AVAX observations put AVAX at $8.1035 at 12:30 UTC and $8.4575 at 12:35. The $0.354 increase works out to 4.37% in five minutes. By 13:00 the series was at $8.443, a little below the immediate post-jump observation. Another leg took it to $8.748 by 13:30. A chart that only marks the initial jump misses the second leg and the hesitation between them.
At 15:45, the series reached $9.0005, the highest observation in the intraday data reviewed. The next observation five minutes later was $8.954, and at 16:00 the series was at $8.9895. In those three observations, the move above $9 was fleeting. The line samples prices at specific times and leaves the price path between observations unknown. It also leaves open whether an individual exchange recorded a different high.
From $8.1035 at 12:30 to $9.0005 at 15:45, the gain was $0.8970 per AVAX, or 11.07% from that starting observation. The subsequent drop to $8.6755 was $0.3250 per AVAX, or 3.61% from the high. In dollar terms, that left $0.5720 of the earlier gain. Dividing $0.5720 by $0.8970 gives 63.77%, which rounds to about 64%.
There is a reason to calculate the retained gain in dollars per token first. The 11.07% rise uses $8.1035 as its denominator, while the 3.61% decline uses $9.0005. Subtracting the two percentages directly would overstate the gain still present relative to the starting point. Against the original $8.1035 observation, the $8.6755 reading was 7.06% higher. That return and the share of the rally retained are different ways of describing the same three observations.
The evening pullback narrowed into a smaller range
The path from the high to the later reading had two distinct phases. At 16:00 UTC the series was still near $9. Over the next three and a half hours it fell to $8.489 at 19:30. Even that reading stood above the $8.4575 observation taken five minutes after the first jump. The later pullback took out much of the second leg while leaving the price near the top of the first jump.
After 19:55 UTC the five-minute observations became less dispersed. The 61 grid points from then through 00:55 UTC ranged from $8.5475 to $8.734, a spread of $0.1865. The final three hours were narrower still, at $8.616 to $8.683 across 37 observations. Those ranges use the highest and lowest sampled prices, including both endpoints. They are useful for showing how far the series moved during each span, even when the start and end readings were close.
The narrower range is also a check on the retained-gain figure. At the low of the final three hours, the same calculation would have put retention at about 57%. At that span’s high, it would have been about 65%. The 64% reading therefore sits near the high end of the late range rather than representing the whole evening. A reader looking at a slightly earlier price could have reached a different percentage while still finding that more than half of the selected rally remained.
The 24-hour comparison isolates the time window
For the day comparison, CoinAbout used prices at 00:00 UTC on November 9 and 00:00 UTC on November 10 from Coinbase’s week series. AVAX rose from $7.926 to $8.6445. The two endpoints are exactly 24 hours apart. They start earlier and end earlier than the rally-retention calculation, so the 9.07% daily gain and the 7.06% gain from the pre-jump observation describe different intervals.
On that same clock, Bitcoin rose from $74,757.91 to $75,257.775, or 0.67%. Ether rose from $2,124.485 to $2,132.075, or 0.36%. All three series quote US dollars and use the same two timestamps. The comparison shows AVAX moving substantially more than those two benchmarks over the measured day.
The four assets moved in different directions. Zcash fell from $1,211.765 to $1,162.12, or 4.10%, on the same series and window. These are a small set of assets, useful for checking whether the direction and magnitude were shared by obvious comparators. A market-wide ranking would require a larger universe. Checking whether the assets moved together during the jump would require observations for each at the same five-minute endpoints.
A shorter reading puts the early November 10 action in perspective. At 23:55 UTC on November 9 the intraday series showed $8.621. An hour later it showed $8.6755, an increase of 0.63%. That comparison comes from observations exactly an hour apart on the same series. It shows a small rebound in the final hour covered here after the larger retreat from the afternoon high. The larger daily gain mostly reflected earlier movement.
What these prices can establish
The dollar prices in this comparison are historical observations from Coinbase’s public series. Assessing execution would require individual trade records and contemporaneous bid and ask sizes. More decimal places preserve the inputs for the calculation. A live execution price depends on the size, venue and state of the order book. Another feed may use a different sampling method or capture trades between the plotted observations.
CoinAbout used the finer series for the rally and the week series for the day-over-day comparison. Keeping those series separate avoids drawing an exact 24-hour conclusion from an intraday feed whose available observations ended short of a full day for the later timestamp. The chart uses a five-minute grid from 12:30 UTC on November 9 to 00:55 UTC on November 10. It shows the path after the chosen starting observation. The midnight return includes earlier activity outside the plotted period.
The starting point matters too. At 12:30 the series already stood above its reading at the start of the UTC day. Selecting the start of the day as the rally baseline would include that earlier change. The 12:30 observation is useful because it immediately precedes the large five-minute step in this series. It defines what the retention percentage measures and keeps the percentage reproducible.
The price path by itself leaves the reason for the jump unresolved. Determining that would require evidence about the timing and direction of orders or other contemporaneous information that ties activity to a specific development. A wide gap between AVAX and Bitcoin or Ether is evidence of relative performance across the sampled endpoints. It cannot distinguish sustained buying from a brief burst followed by lighter activity.
A later observation above $9 would show that the series had returned to the area of the sampled high. A move back to $8.1035 would erase the measured gain from the selected starting point. An order-book snapshot would provide a separate view of available bids and offers. The readout stops at 00:55 UTC, when AVAX was still above its pre-jump price and below the high. Returns calculated from a later feed refresh will use different endpoints and answer a different question.
Send a correction or source question about this article.
Tags
Related Posts
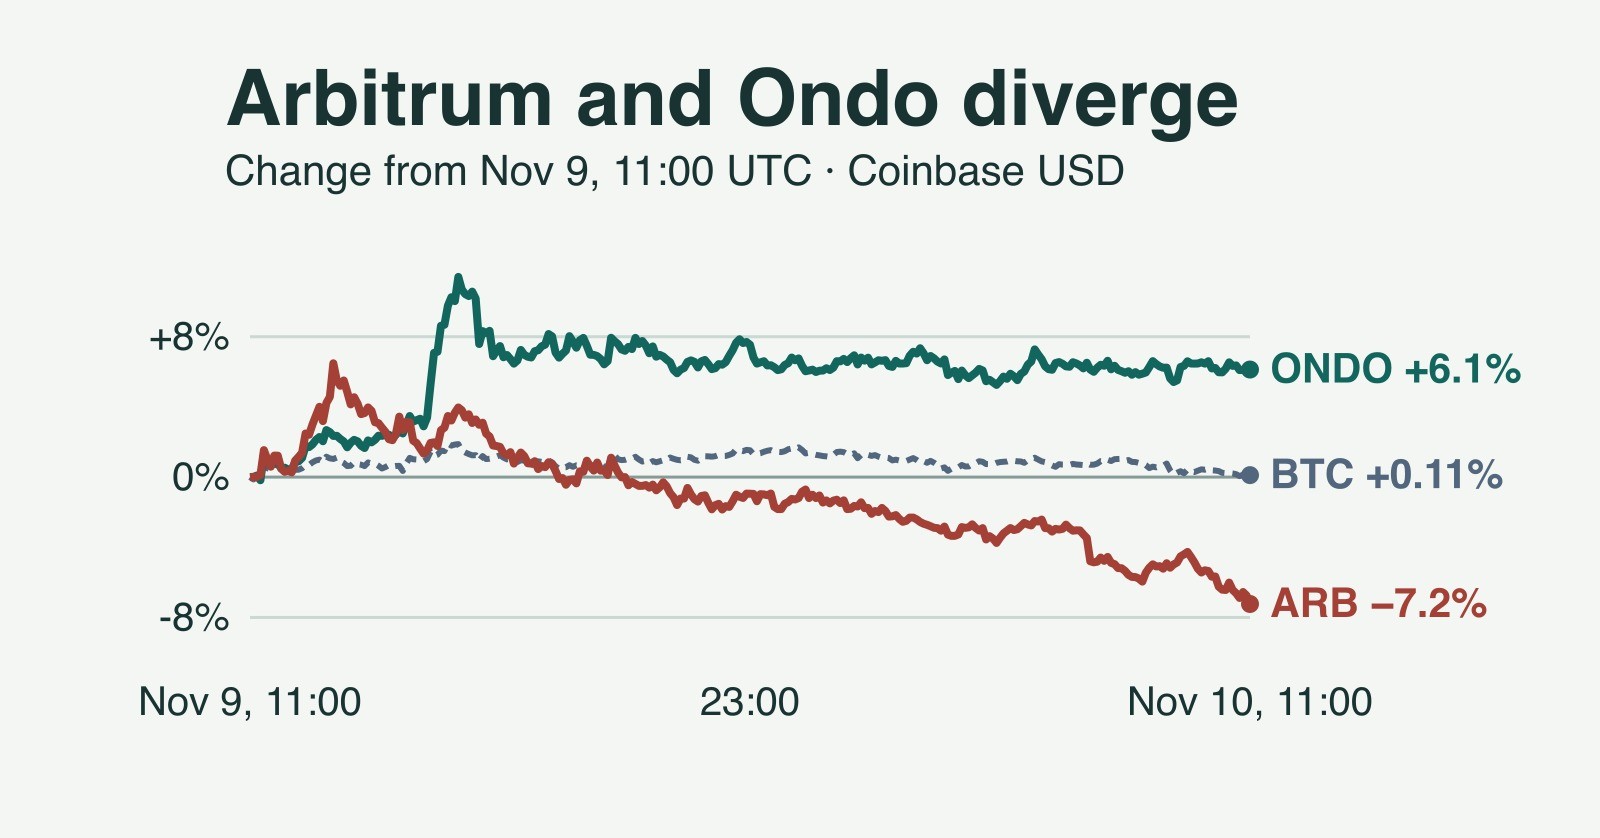
Arbitrum falls 7.2% while Ondo rises 6.1% in the same 24 hours
Arbitrum fell 7.23% and Ondo rose 6.13% in the same Coinbase dollar window. A five-minute timeline shows how the 13.36-point gap opened.
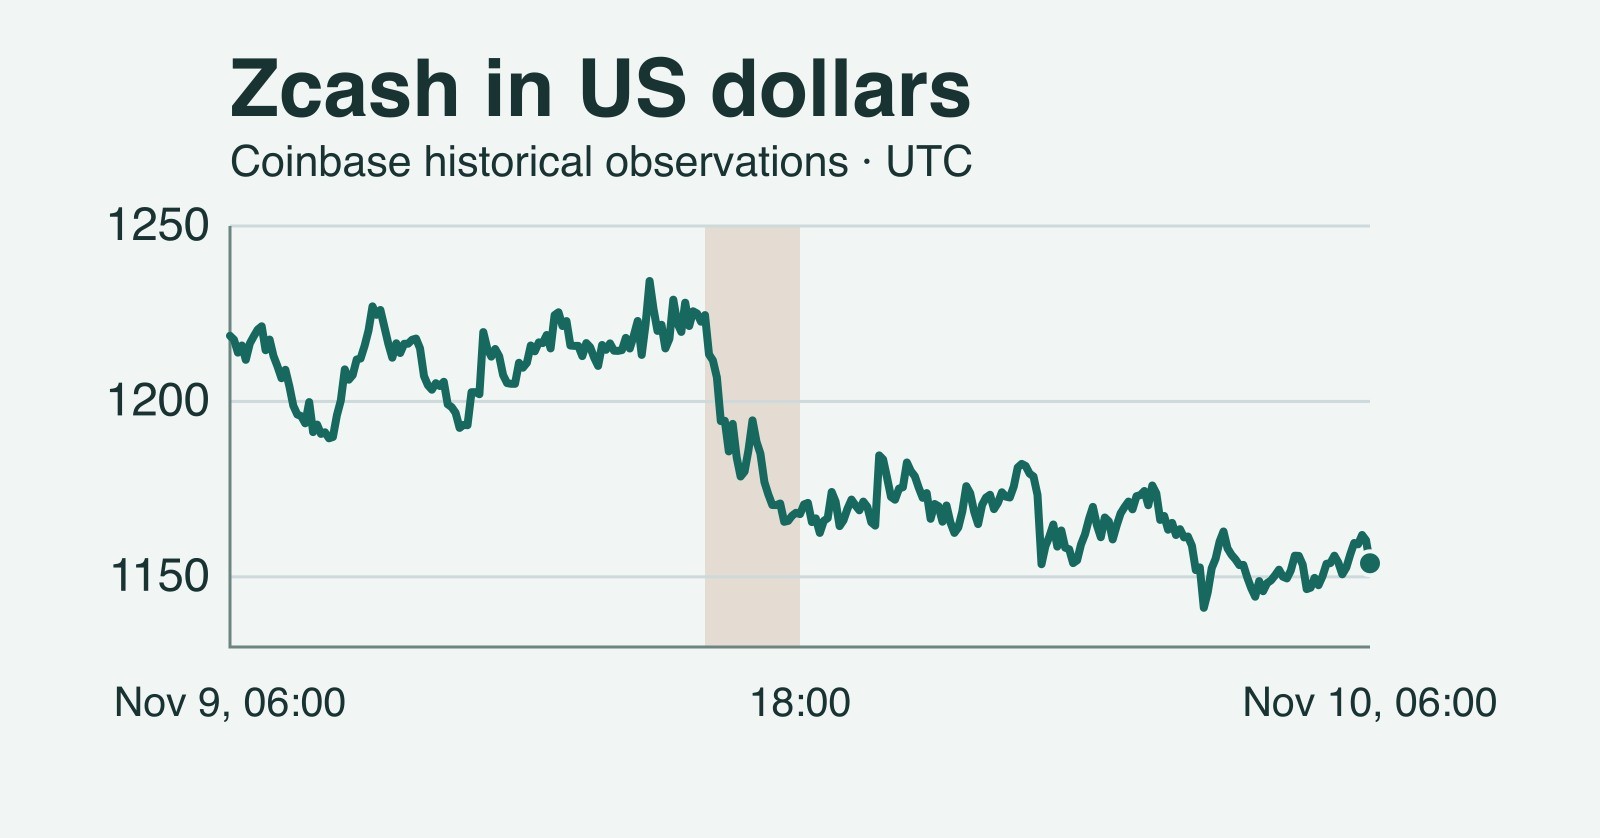
Zcash falls 5.3% in 24 hours, with most of the drop in two hours
Coinbase dollar observations put ZEC at $1,153.87 after a 5.32% decline. Two hours explain most of the loss, while Bitcoin edged higher on the same clock.

Bitcoin dips below $77,000; rebound recovers 29% of sampled decline
Coinbase’s sampled BTC-USD price fell 6.80% from its October 29 high. A rebound to $77,933.80 recovered only 29% of that drop; our timeline separates the measurements.