Bitcoin dips below $77,000; rebound recovers 29% of sampled decline
Coinbase’s sampled BTC-USD price fell 6.80% from its October 29 high. A rebound to $77,933.80 recovered only 29% of that drop; our timeline separates the measurements.
Published

On this page
Bitcoin’s sampled U.S. dollar price fell to $76,314.76 at 02:05 UTC on October 30, 2026, down 6.80% from the previous afternoon’s sampled high. By 03:55 UTC it had rebounded to $77,933.80, recovering about 29% of that dollar decline while remaining below $80,000.
The distinction matters: a 2.12% bounce from the low did not undo the larger fall that preceded it. CoinAbout reconstructed a seven-point timeline from Coinbase’s 300-observation BTC-USD day series. The calculation compares the same provider, currency and retrieved dataset throughout, rather than combining prices from different exchanges or treating a rising final observation as a full recovery.
This is a dated market snapshot, with observations ending at 03:55 UTC on October 30. The data was retrieved at 04:07 UTC. Prices may have changed since then. The series contains sampled reference prices, not a record of every trade or an order book showing what a reader could execute.
The seven-point timeline
All prices below are U.S. dollars per bitcoin. Displayed amounts are rounded to cents; the calculations use the unrounded values returned by Coinbase. The selected points describe the path from the day-window high to the low and subsequent rebound. They are checkpoints within a larger dataset, rather than the only observations available.
October 29, 16:05 UTC — $81,883.85. This was the highest observation in the retrieved day series. It supplies the starting denominator for the subsequent high-to-low decline. It is not presented as Bitcoin’s all-time high, a calendar-day high across all exchanges, or an executable quote for a specified order size.
October 29, 20:00 UTC — $80,746.24. The reference remained above $80,000 at this checkpoint, although it was already below the afternoon maximum. That separates the earlier retreat from the later move through the round-number threshold.
October 29, 20:30 UTC — $80,301.93. The sample was still above $80,000, leaving the round-number threshold intact at this specific observation.
October 29, 21:00 UTC — $78,729.14. This was substantially below the 20:30 UTC reading. Those two observations locate a further decline within that half-hour comparison; they do not establish the exact second of a market-wide threshold crossing.
October 30, 00:00 UTC — $77,776.01. The reference was below $78,000 at the start of the UTC date. This is a timestamped sample, not an official closing auction. A continuously traded asset can have different daily boundaries depending on the data product and timezone a reader chooses.
October 30, 02:05 UTC — $76,314.76. This was the minimum among the 300 returned day observations. The stated low therefore belongs to this particular sampled window. It does not prove that no transaction occurred at a lower price between observations or on another venue.
October 30, 03:55 UTC — $77,933.80. The final observation showed a rebound of $1,619.04 from the sampled low. It was still $2,066.21 below $80,000 and $3,950.06 below the earlier sampled high. The recovery was meaningful in dollar terms but incomplete against both reference points.
Why a 2.12% rebound recovered only 29% of the drop
The first calculation measures the decline from $81,883.85 to the unrounded low of $76,314.755. The difference is $5,569.095. Dividing that loss by the starting high and multiplying by 100 gives a decline of 6.80%.
The rebound uses a different denominator. Subtracting $76,314.755 from the final unrounded observation of $77,933.795 gives $1,619.04. Dividing that gain by the low produces a 2.12% increase. The percentage gain and percentage decline should not be subtracted directly because they are measured against different starting prices.
To answer how much of the original dollar fall was recovered, divide the $1,619.04 rebound by the $5,569.095 decline. The result is 29.07%, or approximately 29%. That leaves about 71% of the measured dollar decline unrecovered at the snapshot cutoff. This comparison describes the selected price path; it does not predict the next observation.
The final reference was also 2.58% below $80,000, using $80,000 as the denominator. Relative to the sampled high, it remained 4.82% lower. These are different questions with different reference values: distance from a familiar threshold, distance from an earlier maximum, and proportion of a particular decline reversed.
A reader comparing headlines can therefore encounter an accurate report of a bounce alongside an accurate report of continuing weakness. The apparent conflict disappears when the observation times and denominators are shown. Neither description alone establishes that a durable reversal has begun.
The week series illustrates a timestamp limitation
CoinAbout also checked Coinbase’s separate BTC-USD week series, retrieved at the same time. It returned 306 observations, running from October 23 at 03:30 UTC through October 30 at 03:00 UTC. Its lowest returned value was also $76,314.755, labeled 02:00 UTC on October 30.
The matching value appears at 02:05 UTC in the day series. That five-minute timestamp difference is a reason to identify the chosen dataset explicitly. It does not establish the time of a particular executed trade. The two windows also had different final timestamps, so their last observations should not be treated as simultaneous quotes.
The day series itself contained intervals of 150, 300 and 600 seconds between neighboring observations. It was not a uniform list of five-minute candles. Calculating a trading volume, a candle close or an exact time spent below a threshold from those price points alone would require assumptions the returned data does not establish.
The week comparison provides broader context without changing the day-window calculation. The $76,314.755 value was the lowest returned sample in that retrieved week dataset, too. This report makes no claim about a monthly low, an all-exchange low, or the lowest transaction price during the period.
What the prices establish about the cause
The series establishes observations and their order. It does not identify who bought or sold, the reason for a transfer, the size of liquidations, or which news item changed traders’ decisions. A price move alongside an exchange or macroeconomic headline is insufficient evidence of causation.
Similarly, the rebound does not prove that buyers absorbed a particular quantity of supply. That conclusion would require suitable trade or order-book data and a defined coverage period. A price-only dataset cannot supply the missing volume denominator, market depth or identities of participants.
Coinbase’s price documentation distinguishes spot reference prices from its buy and sell price products, and warns that rates fluctuate. This comparison does not convert a reference-price move into a realized investment return. Fees, spreads, order size and execution timing can change what an individual transaction achieves.
For a current asset view, CoinAbout’s Bitcoin page shows separate source and freshness context. Its changing quote need not match this frozen historical snapshot. Readers comparing another provider should align currency, observation time and price definition before interpreting the difference.
What would change the interpretation
The strongest counterpoint to the incomplete-recovery reading is that the final sample may capture an early stage of a larger rebound. Later observations could recover more of the decline or reverse the entire selected move. They could also extend the fall. This dataset ends at the stated cutoff and cannot settle either possibility.
A later report should measure any continuation against clearly identified reference points and preserve this snapshot’s original times. Evidence of a cause would need its own primary documentation. Neither a subsequent price update nor a popular explanation should silently rewrite what the earlier data actually showed.
Bitcoin remains exposed to substantial market, liquidity and custody risks. This timeline is a measurement of a sampled price path, not a recommendation to buy the dip, sell the rebound or expect a particular return.
Send a correction or source question about this article.
Related Posts
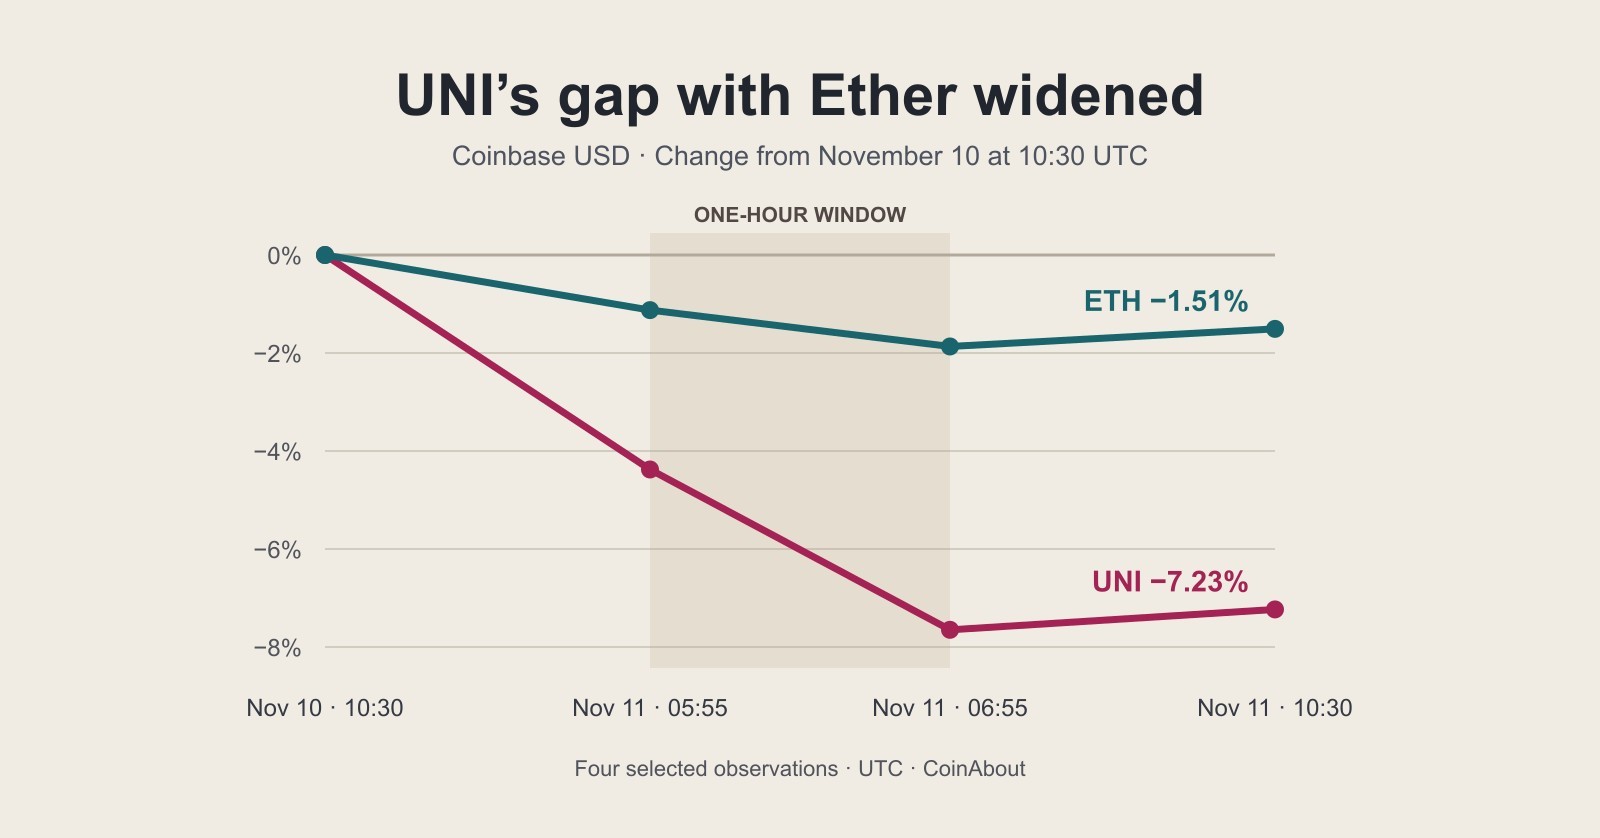
Uniswap falls 7.2% in 24 hours as morning slide widens gap with Ether
UNI fell 3.42% in one hour and ended the matched day down 7.23%. Coinbase and Binance data show that more than half of its final gap with Ether had already formed.
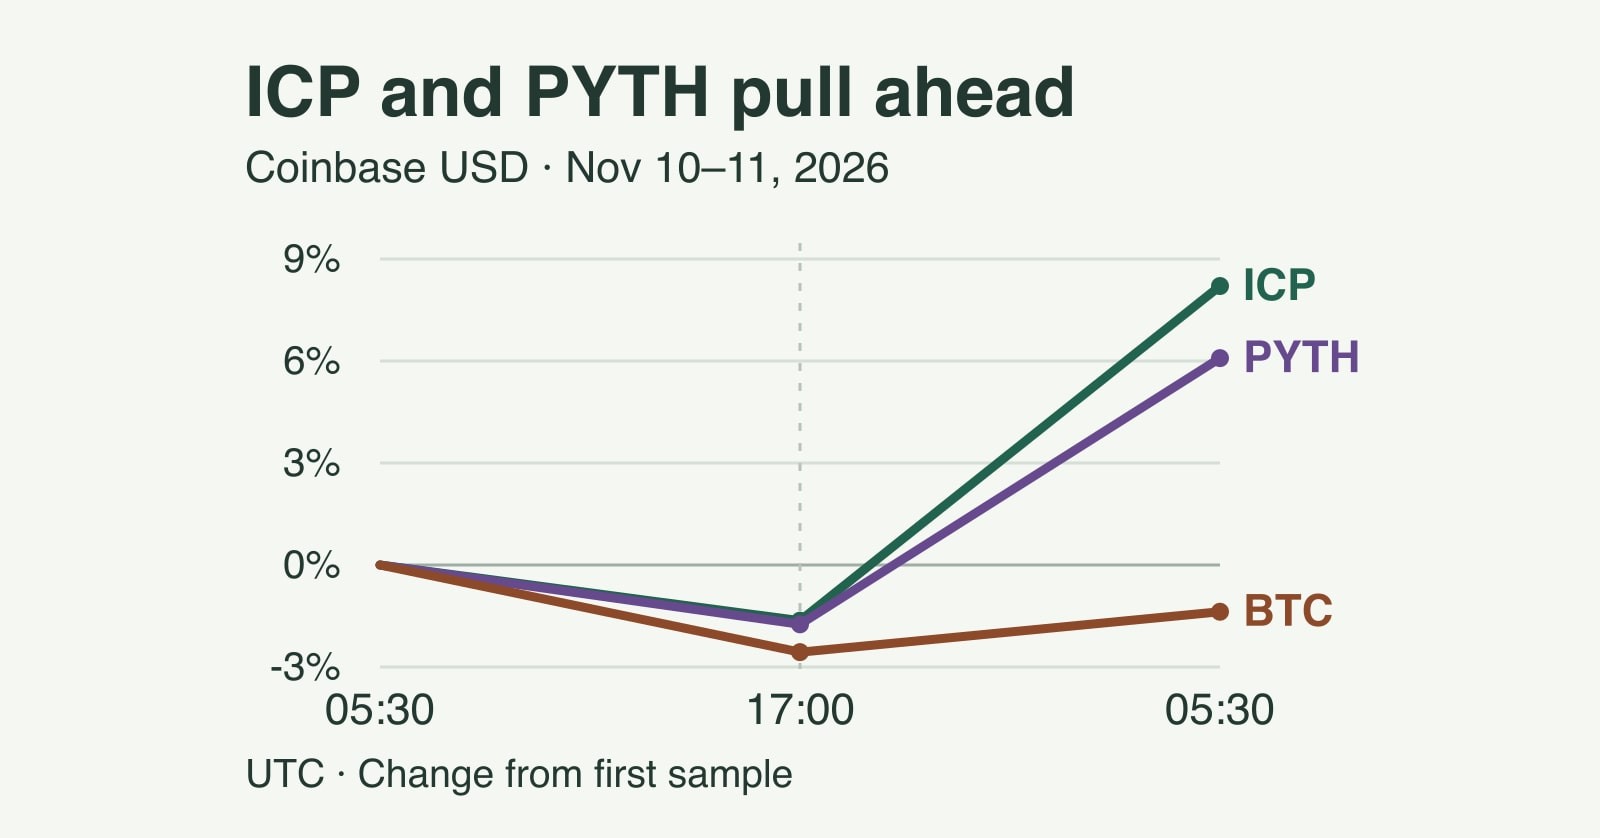
Internet Computer rises 8.2% as Pyth gains 6.1% and Bitcoin lags
ICP and PYTH fell alongside Bitcoin early in a matched 24-hour Coinbase dollar window. Their stronger recovery after 17:00 UTC put both back above their starting prices.
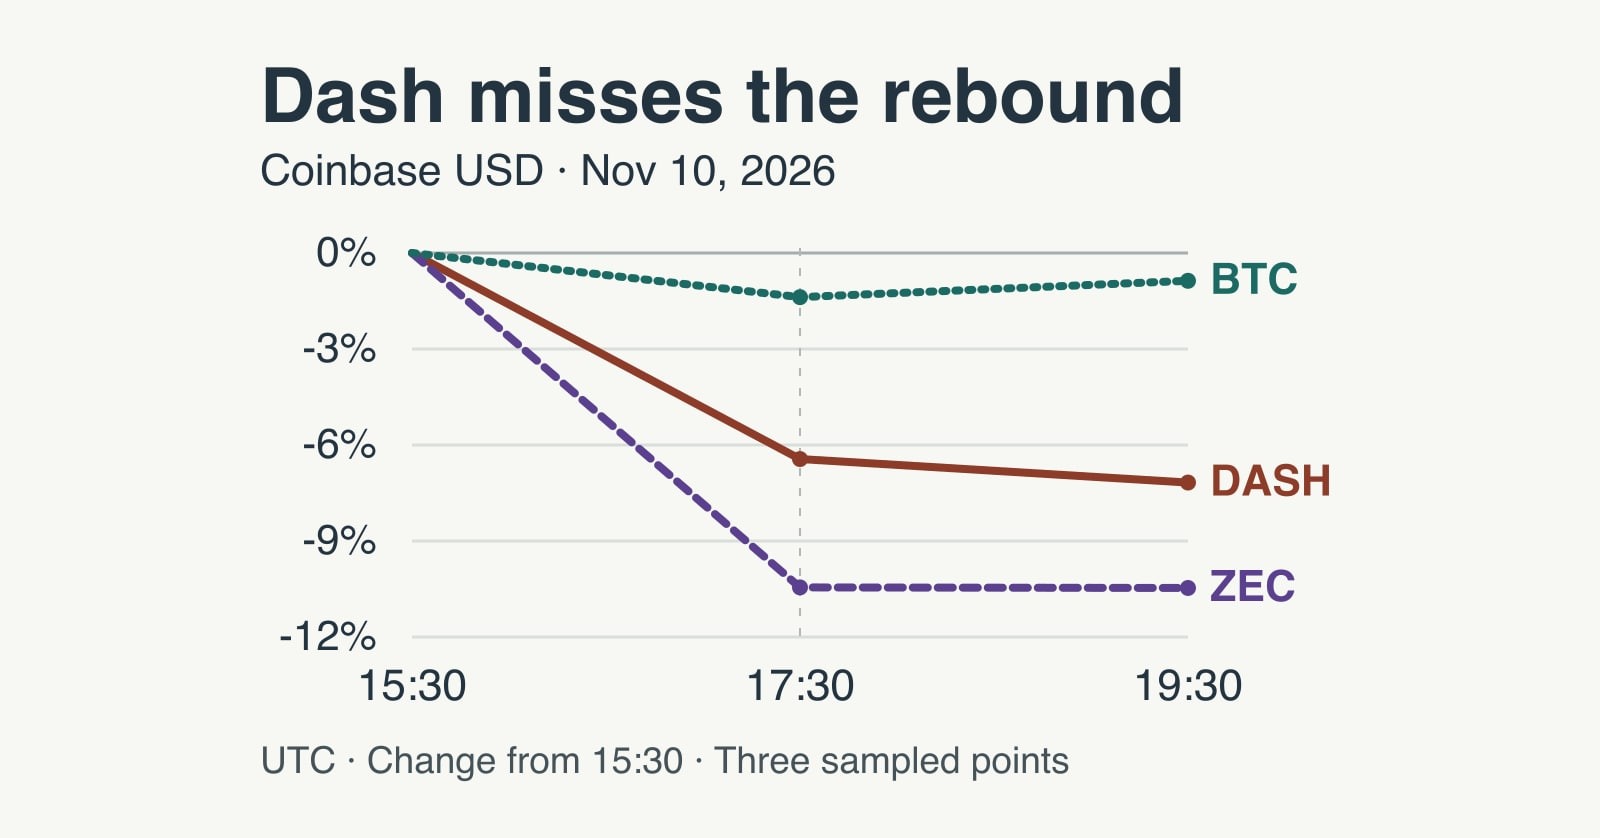
Dash falls 8.1% in 24 hours and misses Bitcoin’s late rebound
Dash fell 8.09% in a matched Coinbase dollar window. In the final two hours, Dash fell further while Bitcoin recovered and Zcash was nearly flat.