Ether falls 5.8% in 24 hours and comes within $4 of $2,000
Ether fell 5.77% in a matched 24-hour Coinbase dollar window. A five-minute comparison shows how its drop and partial rebound differed from Bitcoin and Solana.
Published
On this page
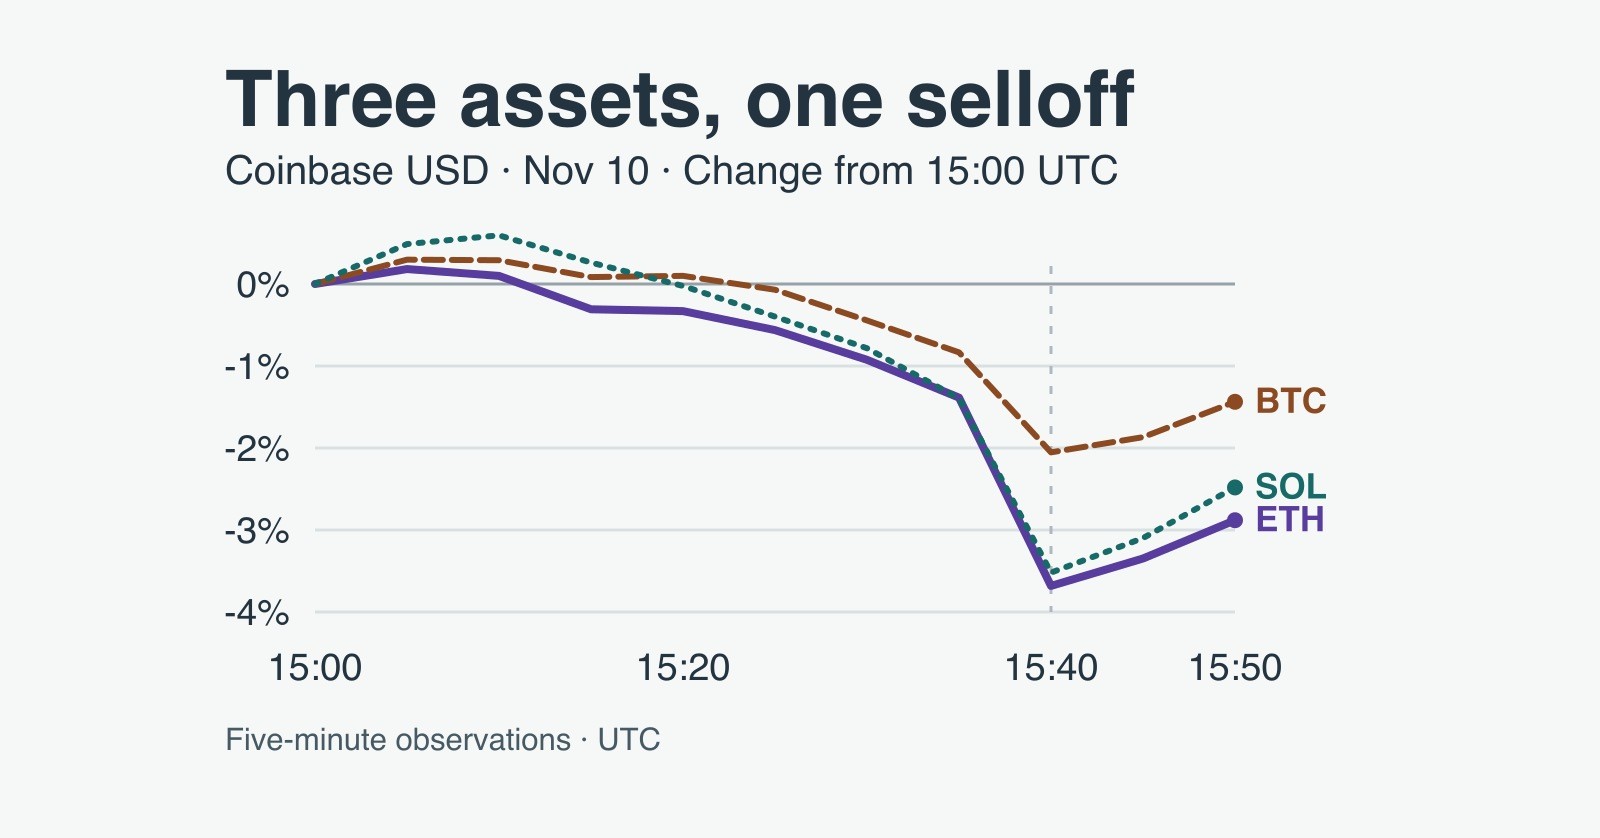
Ether fell 5.77% in the 24 hours to 16:00 UTC on November 10, from $2,145.22 to $2,021.49, in Coinbase’s indicative dollar history. The lowest five-minute observation was $2,003.85 at 15:40 UTC, just $3.85 above $2,000. It was also the lowest observation for Bitcoin and Solana in the 50-minute window where all three series could be compared directly.
CoinAbout’s comparison uses the same starting minute for all three assets. Between 15:00 and 15:40 UTC, Ether fell 3.68%, Solana fell 3.52% and Bitcoin fell 2.05%. The synchronization is more revealing than three separate daily price changes: the sharpest part of Ether’s slide coincided with weakness in the other two assets, even though their percentage losses differed.
How close did Ether get to $2,000?
The Coinbase ETH-USD day series puts Ether at $2,080.445 at 15:00 UTC. It was still at $2,051.615 at 15:35. Five minutes later, the series showed $2,003.85. That $47.765 drop between adjacent samples was 62.36% of the $76.595 decline from 15:00 to the sampled low.
The $3.85 distance from $2,000 is about 0.19% of that round number. That is a description of one observation, not a test of how many orders sat at $2,000 or whether anyone could have bought at $2,003.85. Coinbase’s indicative series reports discrete observations. A price can move between them, so the sample cannot establish whether every dollar trade stayed above $2,000.
What happened at the same time in Bitcoin and Solana?
In Coinbase’s BTC-USD day series, Bitcoin moved from $74,313.875 at 15:00 UTC to $72,788.20 at 15:40. The SOL-USD day series shows Solana falling from $84.235 to $81.27 over the same interval. The chart starts all three assets at zero change at 15:00 and compares observations through 15:50. Dollar prices remain in the source series; the chart compares percentage changes from each asset’s own starting quote.
Ether’s loss at 15:40 was 1.63 percentage points larger than Bitcoin’s and 0.16 points larger than Solana’s, using unrounded returns. It would be misleading to read the similar Ether and Solana losses as proof that one led the other. The five-minute grid places all three lows at the same sampled time in this window. The order of trades inside each interval is outside the dataset.
At 15:50, Ether was at $2,020.51, down 2.88% from 15:00; Bitcoin was at $73,246.135, down 1.44%; and Solana was at $82.145, down 2.48%. The partial bounce was visible in all three. Ending the comparison there gives each asset the same final observation. Extending only Ether to 16:00 is useful for its own 24-hour calculation, but would introduce a ten-minute difference if used to compare the final moves.
How much of the Ether slide did the bounce erase?
By 16:00, Ether was $17.64 above the sampled low. Dividing that gain by the $76.595 decline between 15:00 and 15:40 gives a recovery of 23.03% of the lost dollars. The denominator is the loss during those 40 minutes. Measuring the bounce against the low instead gives a price rise of 0.88%. Both figures describe the same recovery from different starting points.
From 15:00 to 16:00, Ether was still down 2.83%, even though it rose 0.53% in the last 15 minutes and 0.05% in the last five minutes. A short green bar can coexist with a much larger loss because it begins after much of the selling has already occurred. That is why a short-window rebound alone gives a poor picture of how far the market has recovered.
The same distinction applies to a daily headline. At 16:00 UTC, Ether’s 24-hour move was a loss of $123.73 per token. The 15:00-to-16:00 move accounted for $58.955, or about 48% of that dollar decline. This is a decomposition of two movements that end at the same observation. It cannot show how much anyone lost unless their own trade times and execution prices happen to match the examples.
Why the 24-hour cutoff matters
The Coinbase ETH-USD week series supplies the prior day’s exact 16:00 UTC opening observation; the day series supplies the current end and the five-minute sequence. At a cutoff 30 minutes earlier, the same calculation used $2,127.315 at 15:30 UTC on November 9 and $2,061.205 at 15:30 UTC on November 10. The result was a 3.11% loss, before the most abrupt leg of the drop captured here. Both comparisons cover exactly 24 hours. They answer what happened over different intervals.
The two Ether histories agreed at 41 of their 42 shared timestamps in the retrieved snapshots. At 13:30 UTC on November 10 the day series showed $2,096.395 and the week series showed $2,035.14. CoinAbout used the higher-frequency day series wherever available and the week series only for the earlier opening observations. The conflicting timestamp is outside the three-asset comparison and is not a start, end or low used in the calculations. For Bitcoin and Solana, the comparison uses only their day series.
A threshold can be tested at several levels of precision. Here, the strongest available statement is about Coinbase’s sampled dollar series. An exchange’s individual dollar trades could resolve what happened on that order book between samples. A second liquid dollar venue could then show whether the crossing was venue-specific. A stablecoin quote near the same number is useful context, but it cannot resolve either question on its own.
A later live quote may already be above or below these figures. The observation window captures a fast selloff and partial rebound near a round number; it cannot establish a lasting floor, a market-wide low or the reason the assets fell together. Spreads, fees, slippage and the choice of quote currency can all change what a trader actually sees.
The five minutes that changed the comparison
Between 15:35 and 15:40 UTC, Bitcoin fell about 1.23%, Solana fell 2.16% and Ether fell 2.33%, measured from their respective 15:35 observations. Those last five minutes accounted for 59.38% of Bitcoin’s dollar decline from 15:00 to 15:40, 60.37% of Solana’s and 62.36% of Ether’s. CoinAbout divided each five-minute dollar loss by the same asset’s full 40-minute dollar loss. Comparing each asset with its own denominator avoids letting Bitcoin’s higher price dominate the comparison.
The three also recovered different shares by 15:50. Bitcoin regained 30.02% of the dollars it had lost from 15:00 to 15:40; Solana regained 29.51%; Ether regained 21.75%. Ether’s 23.03% recovery at 16:00 uses ten additional minutes. Putting that later figure next to the other two without specifying the time would make the recoveries look more comparable than they are.
A trader reading the 24-hour number can also separate two changes in the comparison itself. Moving the cutoff from 15:30 to 16:00 raised the prior day’s opening Ether observation by about $17.91, while it lowered the current day’s end by about $39.72. Those two endpoint changes widened the measured dollar loss from about $66.11 to $123.73. The 2.66-point difference between the reported returns therefore reflects a higher starting price as well as a lower ending price. A reader trying to reproduce either number needs both timestamps, not just the date on the headline.
The next useful comparison is whether a later, timestamped dollar observation actually falls below $2,000 and whether a second liquid dollar venue corroborates it. That would answer a different question from the one this window resolves: Ether approached the level, other large assets weakened at the same sampled time, and most of Ether’s 40-minute dollar loss was still present at 16:00 UTC.
Send a correction or source question about this article.
Related Posts
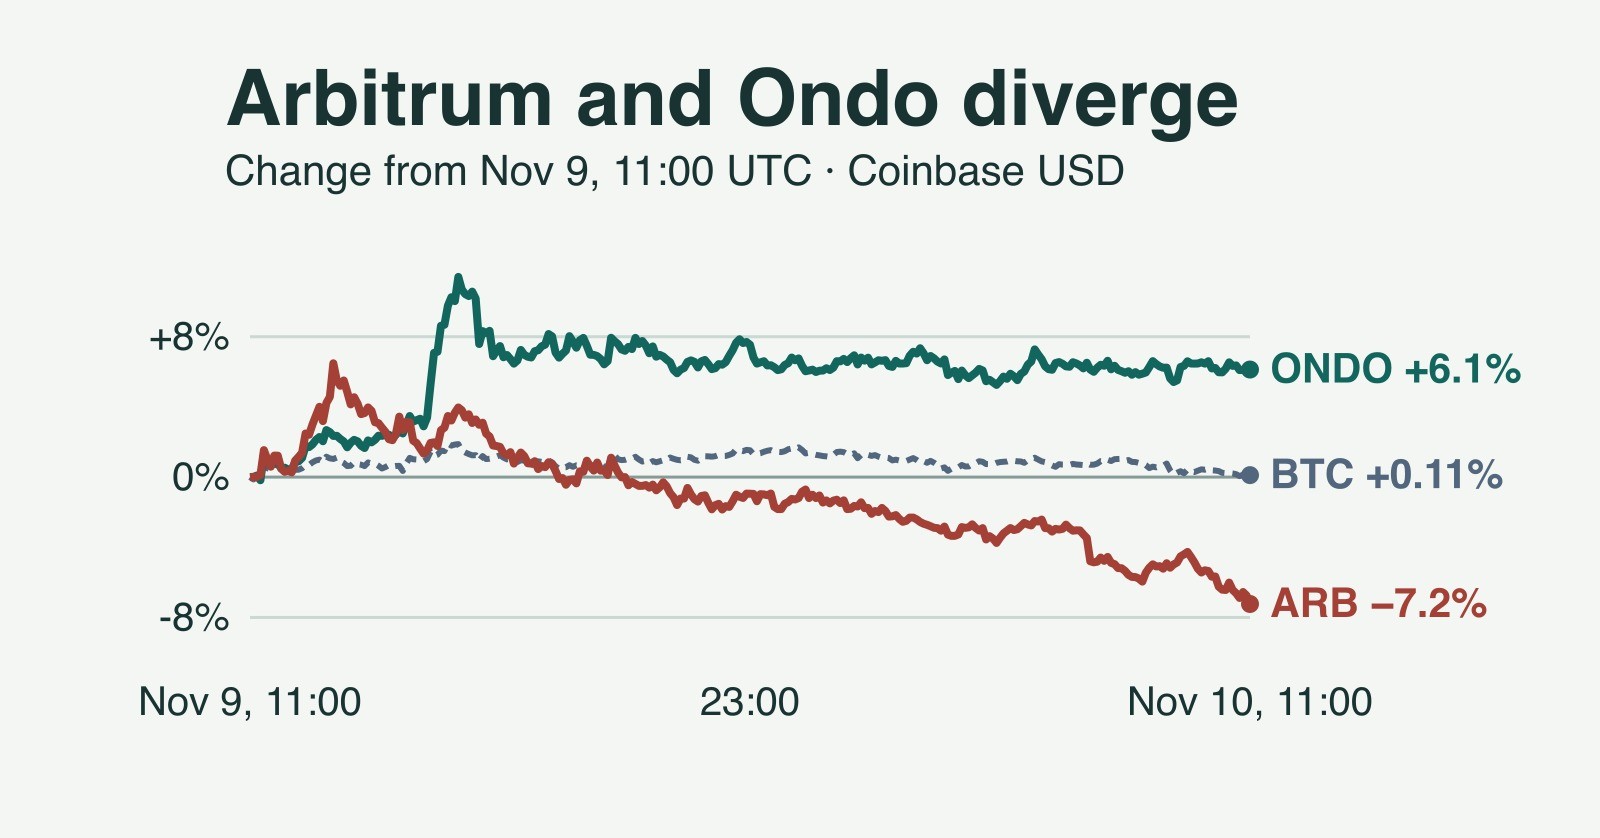
Arbitrum falls 7.2% while Ondo rises 6.1% in the same 24 hours
Arbitrum fell 7.23% and Ondo rose 6.13% in the same Coinbase dollar window. A five-minute timeline shows how the 13.36-point gap opened.
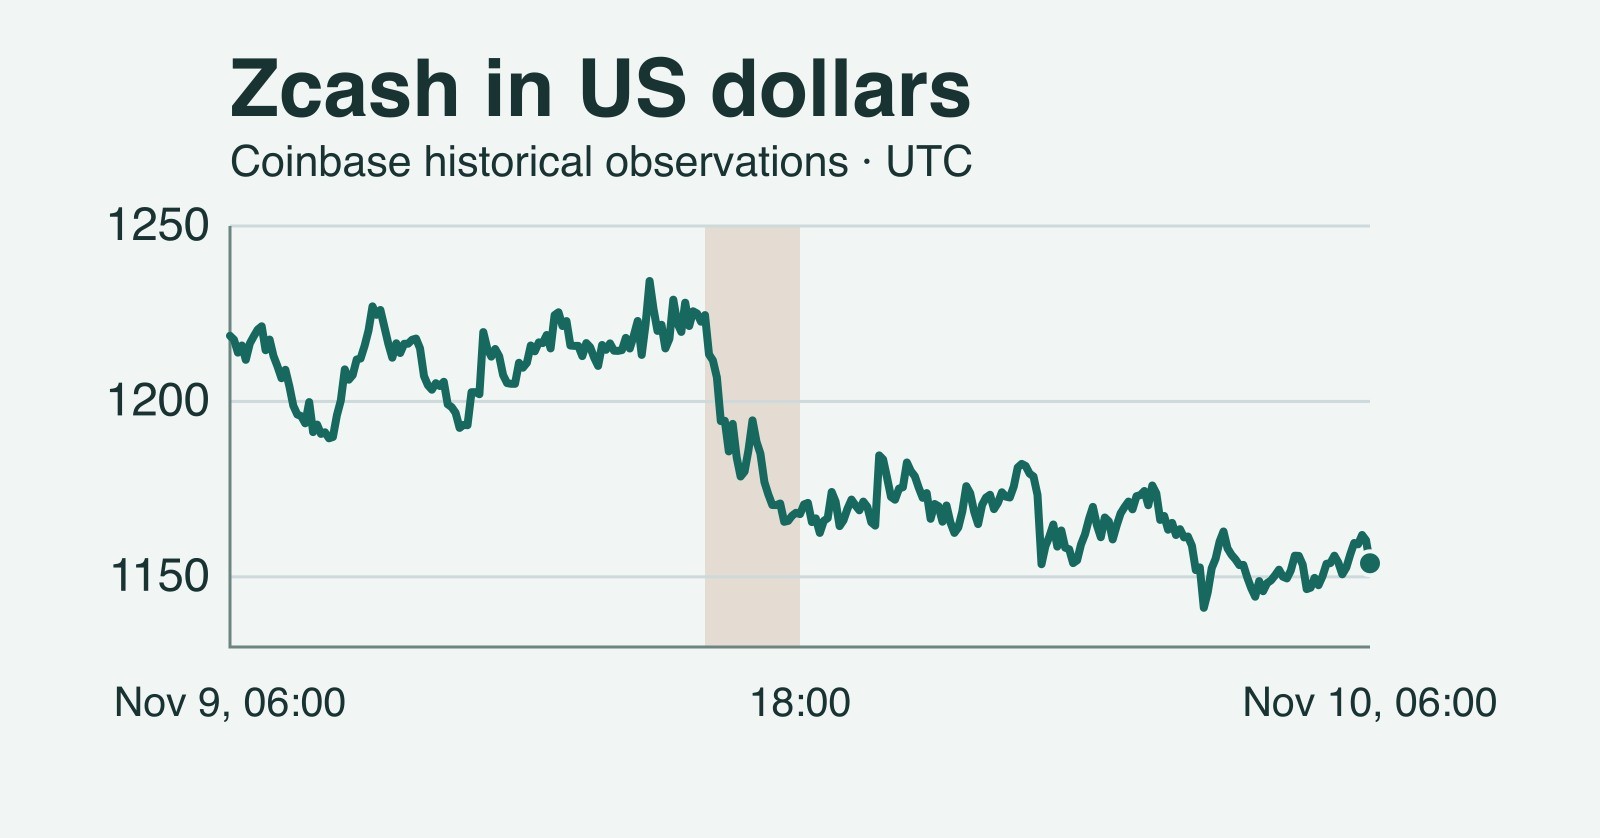
Zcash falls 5.3% in 24 hours, with most of the drop in two hours
Coinbase dollar observations put ZEC at $1,153.87 after a 5.32% decline. Two hours explain most of the loss, while Bitcoin edged higher on the same clock.
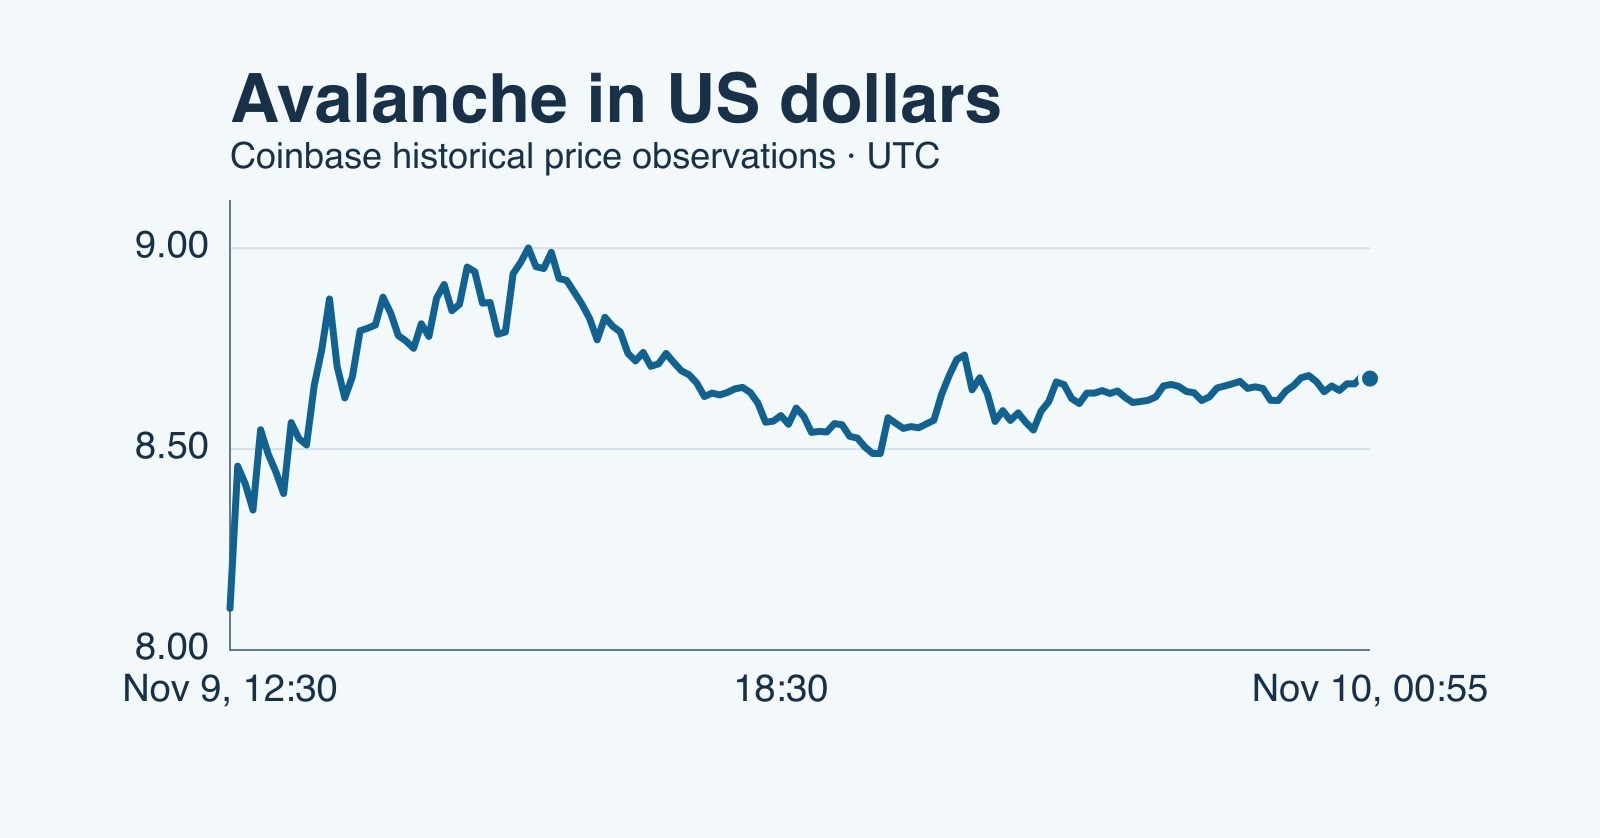
Avalanche rises 9% in 24 hours and keeps most of its rally
AVAX gained 9.07% in a matched 24-hour dollar window. Five-minute data show how much of the November 9 surge held after the price briefly touched $9.