Internet Computer rises 8.2% as Pyth gains 6.1% and Bitcoin lags
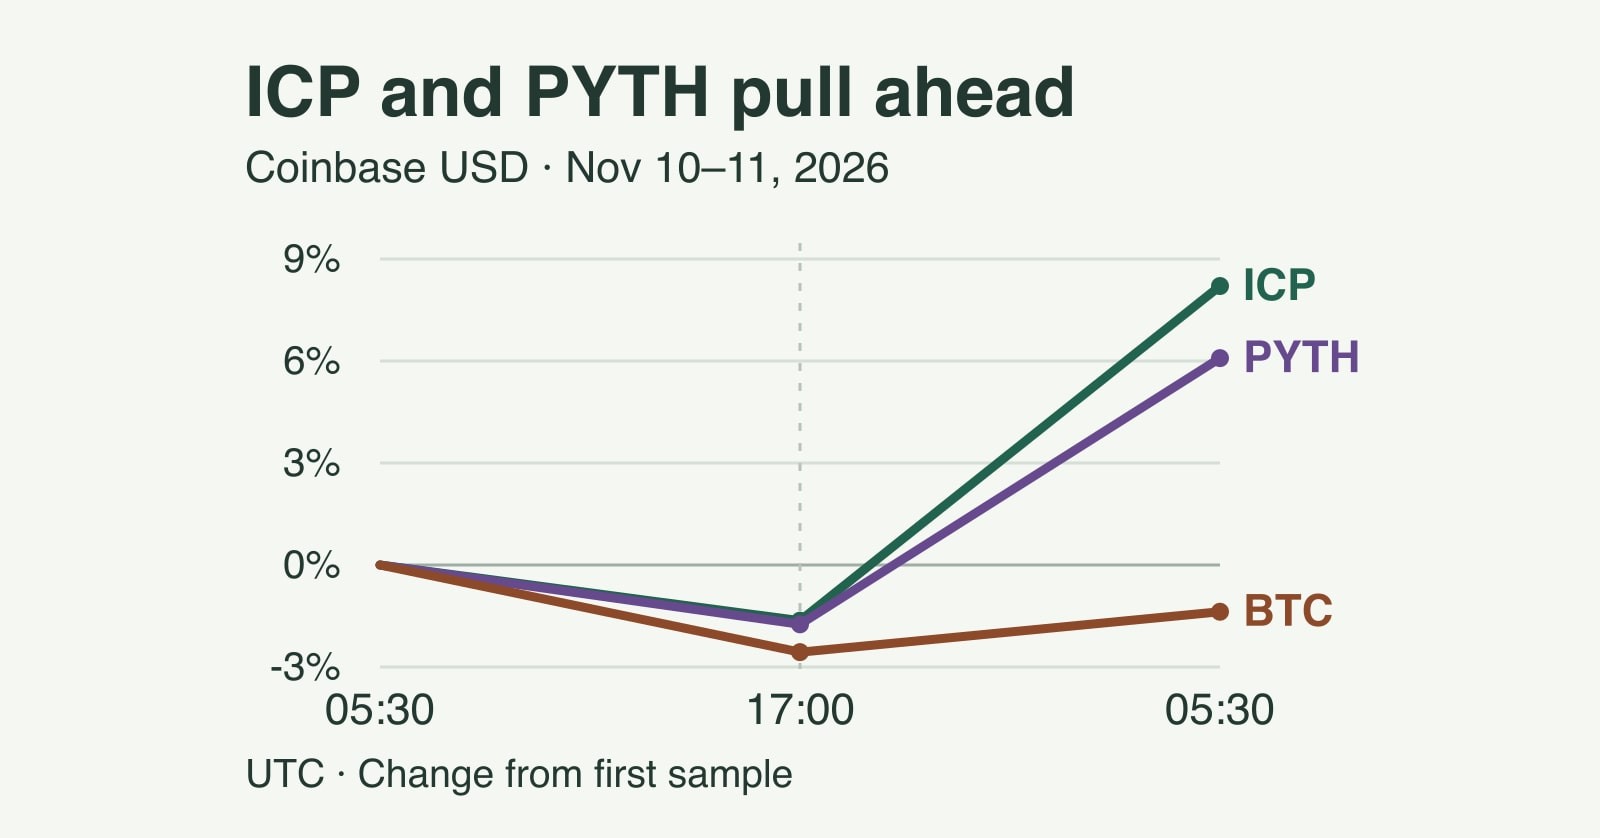
ICP and PYTH fell alongside Bitcoin early in a matched 24-hour Coinbase dollar window. Their stronger recovery after 17:00 UTC put both back above their starting prices.
Published
On this page
Internet Computer’s ICP token rose 8.21% and Pyth Network’s PYTH gained 6.08% in the 24 hours to 05:30 UTC on November 11, 2026, while Bitcoin fell 1.37% in the same Coinbase dollar histories. The timing matters. All three were down at 17:00 UTC the previous day, and the gap widened when ICP and PYTH rebounded more sharply than Bitcoin.
The comparison uses two fixed windows within the same day. By the split at 17:00 UTC, ICP was down 1.64%, PYTH was down 1.75% and Bitcoin was down 2.56%. Over the following 12 hours and 30 minutes, ICP rose 10.01%, PYTH rose 7.97% and Bitcoin rose 1.22%. The split shows how two assets that fell alongside Bitcoin earlier ended up with positive daily returns.
The three prices behind each move
In Coinbase’s weekly ICP dollar history, Internet Computer started at $2.40145 at 05:30 UTC on November 10. The sample was $2.36210 at 17:00, then $2.59850 at 05:30 on November 11. The full move was $0.19705. Dividing that change by the starting $2.40145 gives 8.21%. Measuring the later recovery from $2.36210 gives 10.01%, since that calculation starts from the lower afternoon price.
Coinbase’s weekly PYTH dollar history puts Pyth at $0.06533, $0.06419 and $0.069305 at the same three times. The day’s increase was $0.003975 per token, or 6.08% of the starting price. The later rise from $0.06419 added $0.005115. Part of that gain restored the $0.00114 lost in the first portion of the window. The rest took PYTH above its starting level.
In Coinbase’s weekly Bitcoin dollar history, BTC went from $74,709.945 to $72,794.69 and then to $73,682.89. The rebound regained $888.20 of the $1,915.255 lost between the first two samples, about 46% of the earlier dollar decline. Bitcoin’s final sample remained $1,027.055 below the previous morning’s level. ICP finished 9.58 percentage points ahead of BTC over the 24 hours, and PYTH finished 7.46 points ahead.
Returns in the two segments use different starting prices. Adding them directly would therefore overstate each altcoin’s daily gain. The price comparison also keeps the assets’ dollar scales separate. A fraction of a cent is meaningful for PYTH at its quoted level, and the much larger dollar move in Bitcoin reflects a different starting price per token.
When the comparison changed
The 17:00 UTC checkpoint was chosen because all three weekly series carry an observation at that time and the day histories agree on the values. It sits 11 hours and 30 minutes into the 24-hour window. Its role is to show what had happened by a common observation, rather than locate the exact start of each rebound. Prices can make several turns between the three markers on the chart.
The finer day histories show how an earlier common snapshot tells a different story. At 15:40 UTC on November 10, ICP’s day history showed $2.33650 and PYTH’s day history showed $0.063765. Bitcoin’s day history showed $73,176.80. All were below their starting marks. The ICP and PYTH samples had improved by 17:00 UTC, while the Bitcoin sample was lower than it was at 15:40. By the end of the window, Bitcoin had also risen from its 17:00 level.
This matters when using Bitcoin as a benchmark. Relative strength can mean losing less during a shared decline or gaining more when prices recover. Both comparisons can contribute to the same 24-hour gap. In this case, the returns after 17:00 were far more different than the early losses. ICP and PYTH were already ahead of Bitcoin in percentage terms at the split, but their positive daily readings depended on the later recovery.
ICP and PYTH also give different information from one another. At the shared 17:00 sample, their declines from the morning start were about a tenth of a percentage point apart. Over the later segment, ICP gained about two percentage points more than PYTH. These are two separately quoted assets. The comparison describes their prices in this interval and gives no measure of shared demand, transfers between the tokens or a link between the projects’ activity.
The share of the earlier loss recovered is another way to compare the three paths. ICP lost $0.03935 in the first segment and added $0.23640 in the second, about six times the decline. PYTH added about 4.49 times its earlier loss. Each ratio uses its own token’s price change in dollars. A value above one means the later rise carried the sampled price past its opening level. Bitcoin recovered less than half its early loss using the same calculation.
The ranking also becomes clearer when the changes are measured on a single starting scale. At 17:00, ICP led BTC by 0.925 percentage points and PYTH led it by 0.82 points. By 05:30 those leads had widened by 8.66 and 6.64 percentage points, respectively, using the November 10 opening price as the base throughout. That difference in the gaps measures how much relative strength emerged after the checkpoint without adding returns calculated from different bases.
The result holds at a second cutoff
A 24-hour move can look different when a volatile late observation rolls into or out of the calculation. Using the same weekly histories and ending the window at 04:00 UTC instead of 05:30 puts ICP up 8.17%, PYTH up 5.80% and Bitcoin down 1.05%. That earlier window preserves the order and direction of the three returns. It also shows why the cutoff belongs next to the headline numbers. PYTH’s return, for example, was about 0.28 percentage points lower in the earlier window.
At the later common sample of 05:50 UTC in the day histories, ICP had slipped to $2.58830 and PYTH to $0.06914. Bitcoin had risen to $73,865.735. Those observations cover 20 minutes after the main endpoint. They provide a check on how quickly the comparison can shift over shorter periods, even though the fixed 24-hour calculation still describes its original window.
For the three assets, each day history shared 44 timestamps with its weekly history. One price per asset differed across the two downloads. The disagreements were at 05:00 UTC on November 11 for ICP, 04:30 that morning for PYTH and 16:30 on November 10 for Bitcoin. The primary endpoint and the 17:00 split agree across both downloads, as does the alternate 04:00 endpoint. The earlier opening prices come from the weekly histories because those timestamps fall outside the day downloads. No disputed observation goes into the published segment returns.
What the data can establish
The weekly histories establish a common dollar comparison across the three assets. The day histories provide more detail between those markers and help check whether the selected endpoints agree. Prices are sampled values from the provider. A sample gives no assurance that a trader could have executed at that price or at the same price on another exchange. The comparison makes no claim about the highest or lowest traded price, trade sizes or the cause of the move.
The strongest reason to be cautious about calling the two tokens exceptions is that they moved with Bitcoin at key points. All three were lower at 17:00 and all three were higher at the final checkpoint than they had been at 17:00. To judge whether the relative strength continued, the relevant check is a new matched window with the same assets, quote currency and observation times. A later gain in Bitcoin alone, or a fresh quote for just one token, cannot establish whether that gap persisted. Crypto prices can change quickly, and these historical samples do not establish future returns or available liquidity.
Send a correction or source question about this article.
Related Posts
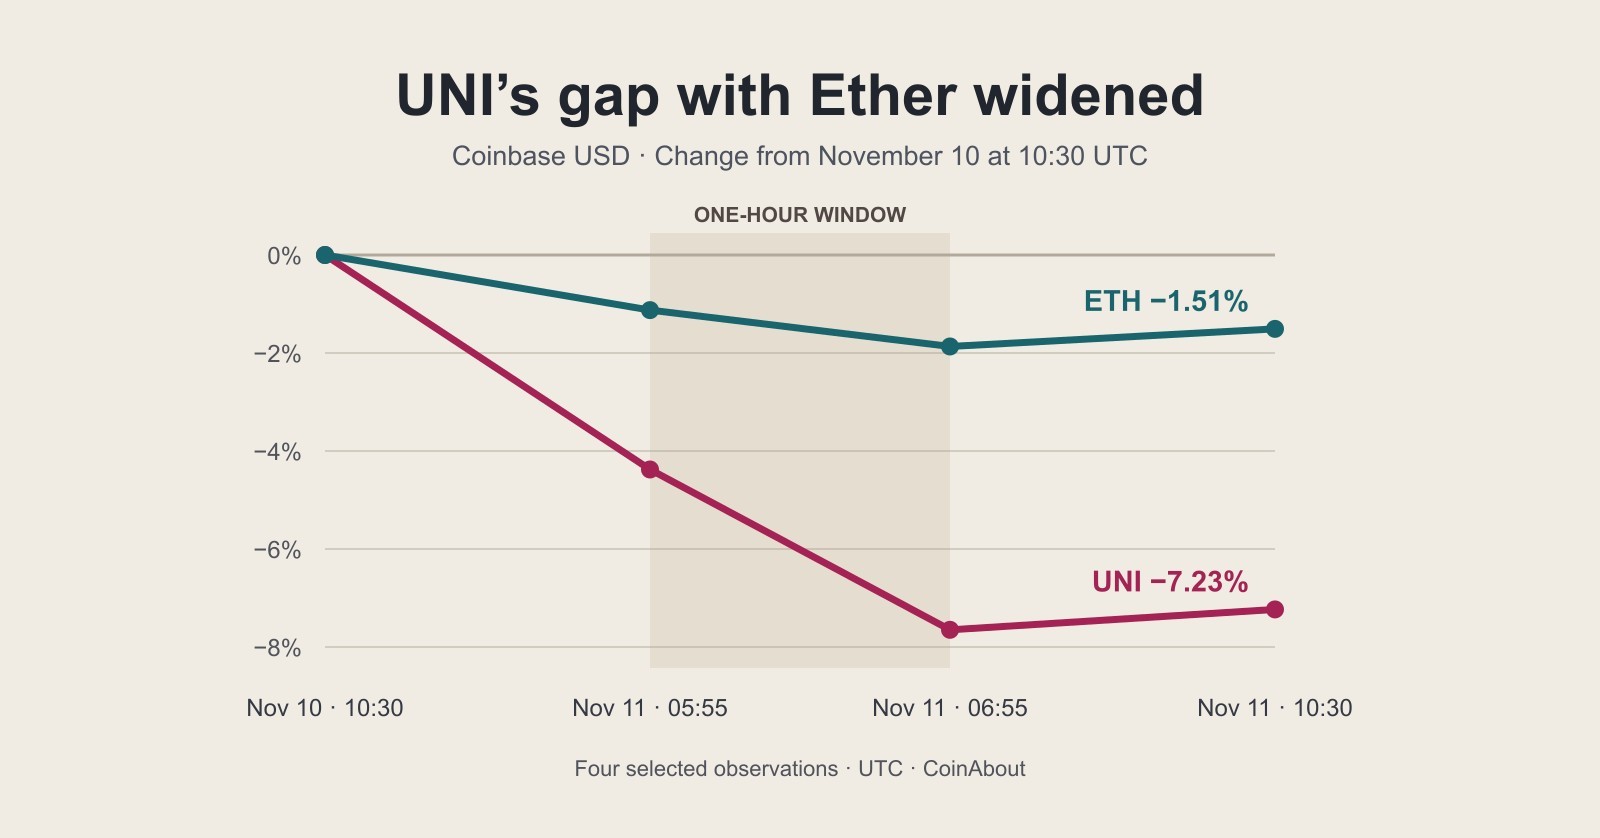
Uniswap falls 7.2% in 24 hours as morning slide widens gap with Ether
UNI fell 3.42% in one hour and ended the matched day down 7.23%. Coinbase and Binance data show that more than half of its final gap with Ether had already formed.
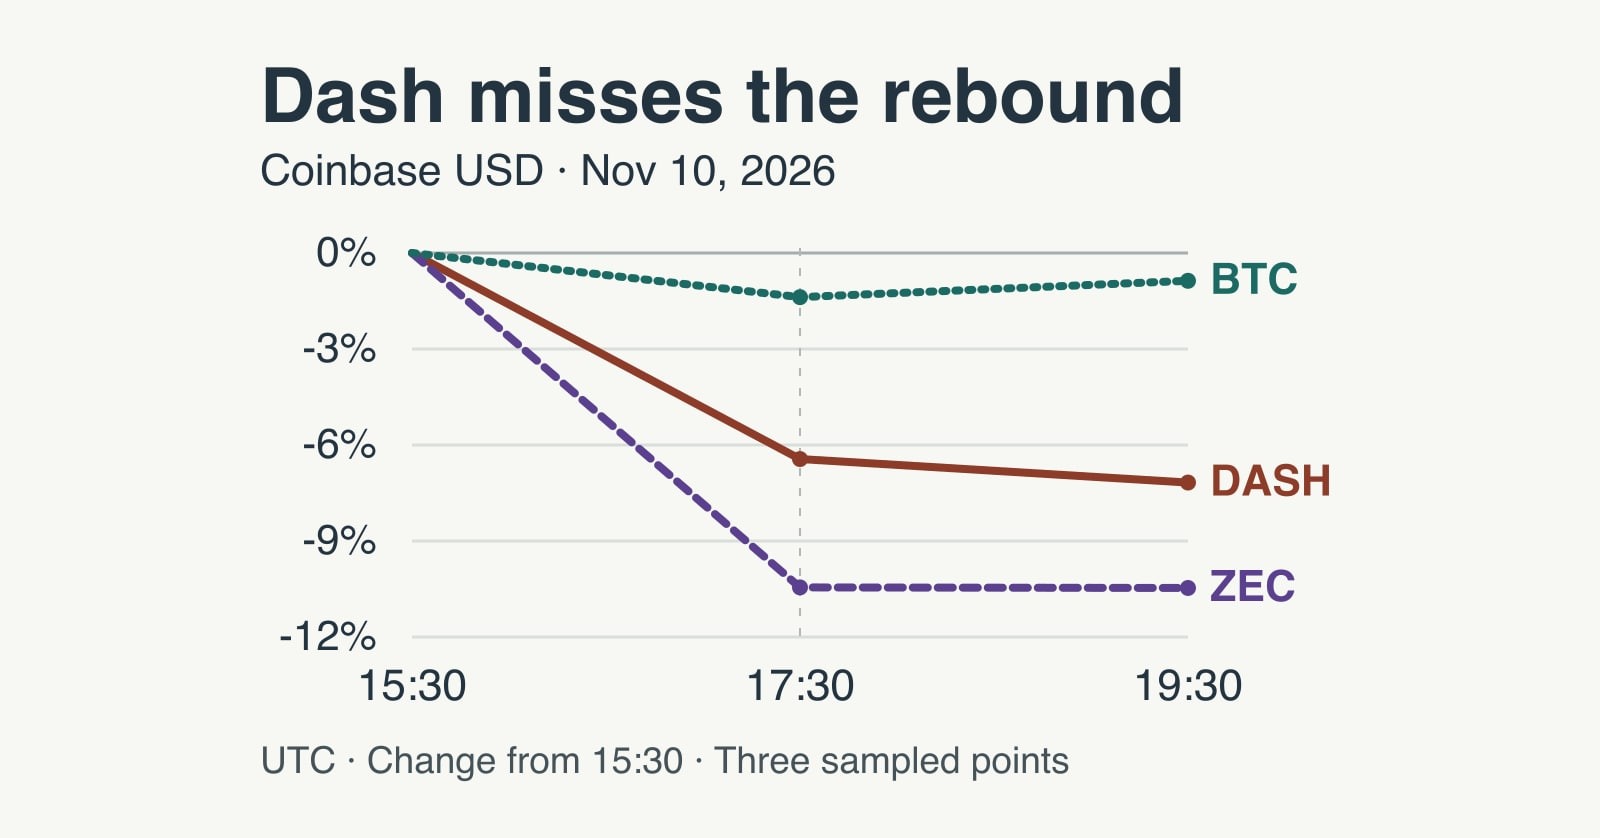
Dash falls 8.1% in 24 hours and misses Bitcoin’s late rebound
Dash fell 8.09% in a matched Coinbase dollar window. In the final two hours, Dash fell further while Bitcoin recovered and Zcash was nearly flat.
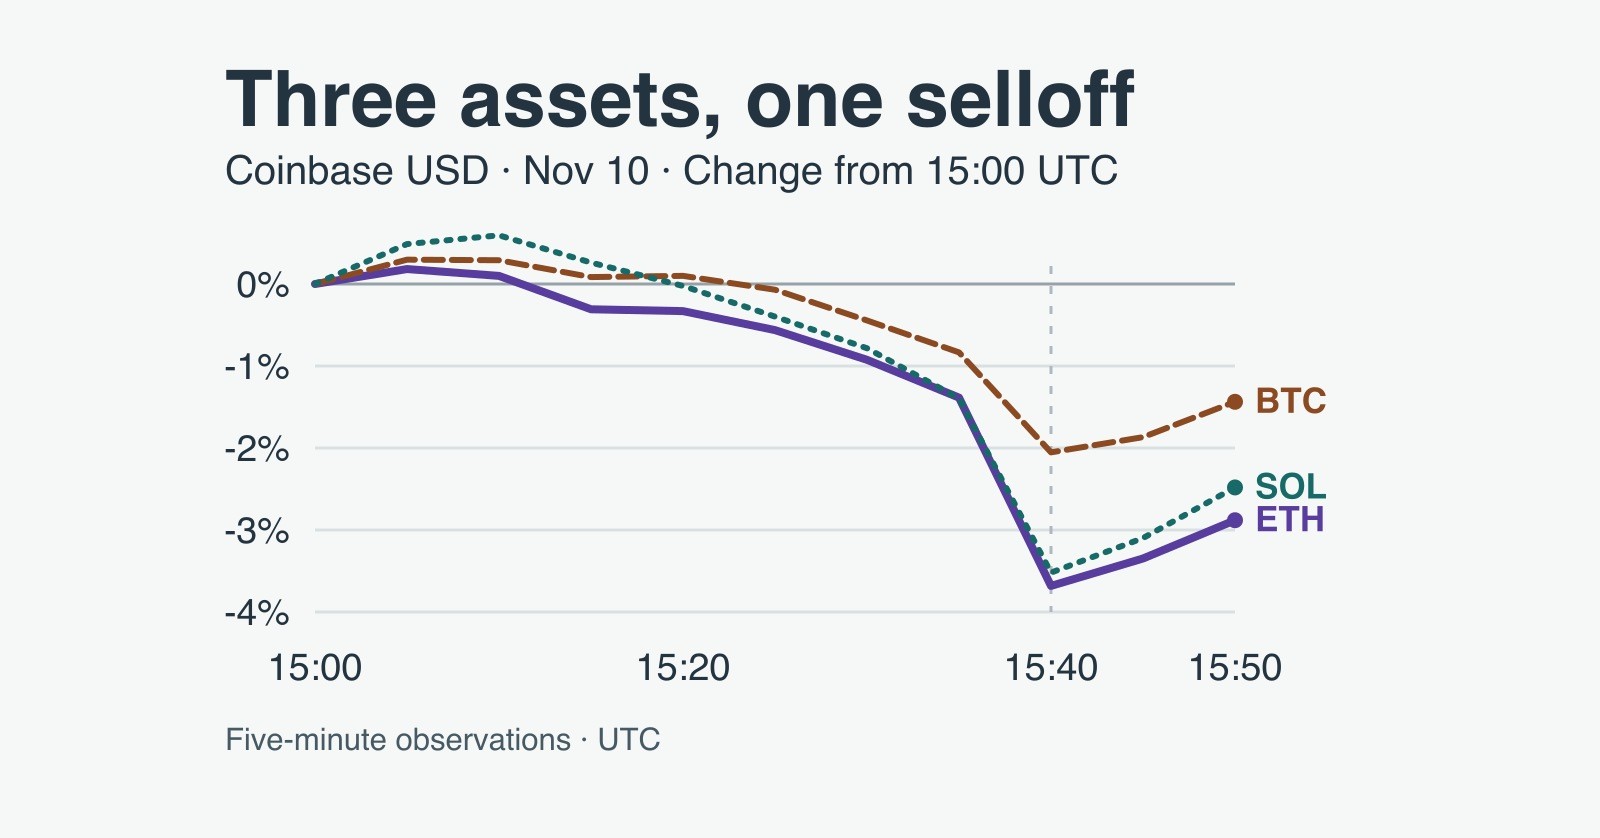
Ether falls 5.8% in 24 hours and comes within $4 of $2,000
Ether fell 5.77% in a matched 24-hour Coinbase dollar window. A five-minute comparison shows how its drop and partial rebound differed from Bitcoin and Solana.