Uniswap falls 7.2% in 24 hours as morning slide widens gap with Ether
UNI fell 3.42% in one hour and ended the matched day down 7.23%. Coinbase and Binance data show that more than half of its final gap with Ether had already formed.
Published
On this page
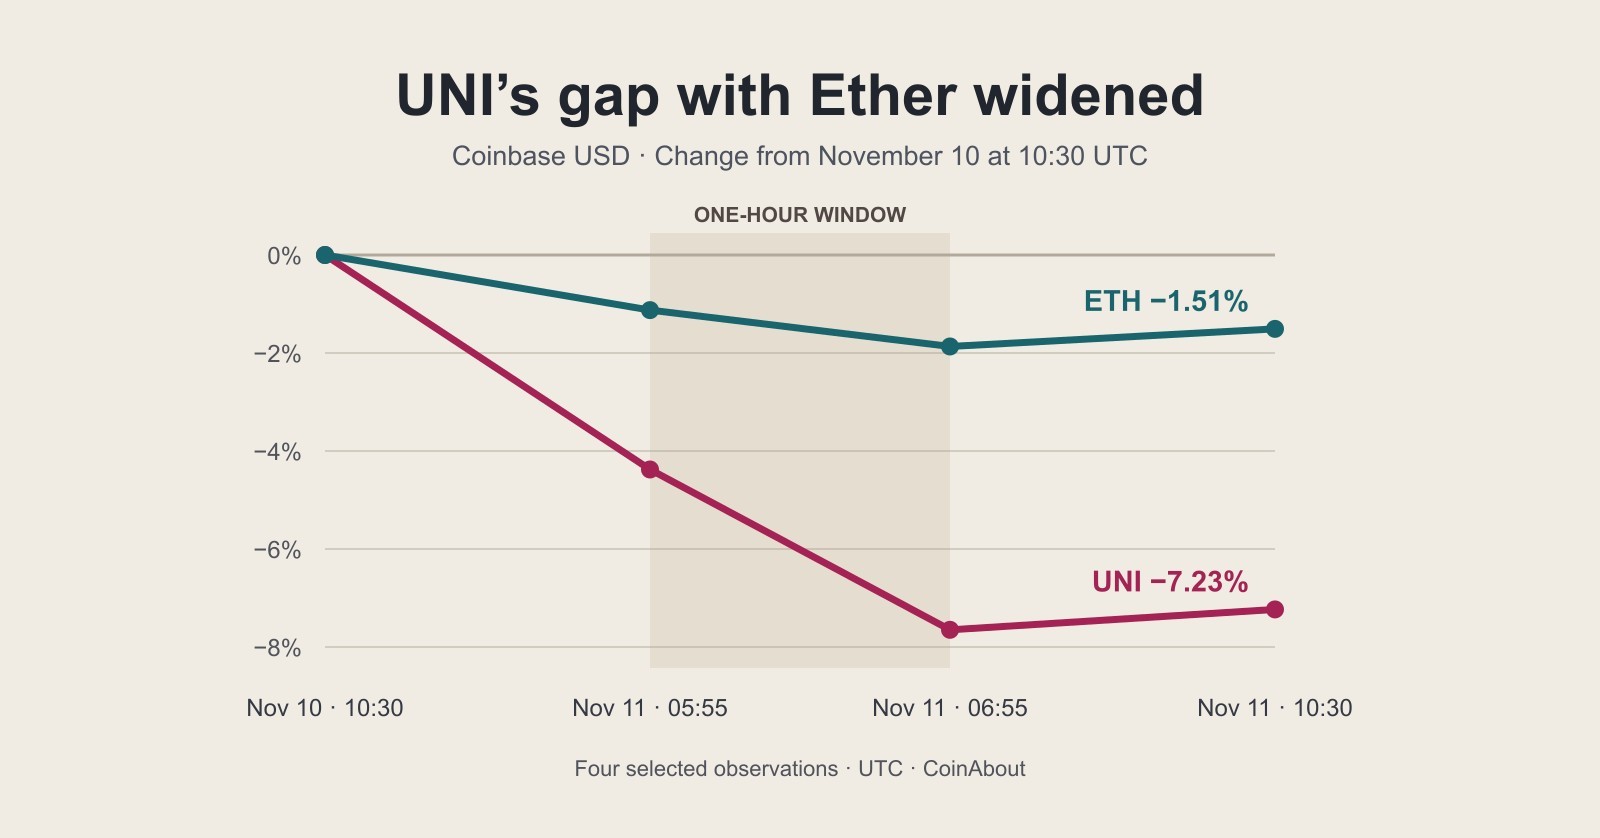
Uniswap’s UNI token fell 7.23% in the 24 hours to 10:30 UTC on November 11, 2026, while Ether fell 1.51% over the same interval in Coinbase’s dollar histories. UNI dropped 3.42% in the hour to 06:55 UTC. By the end of that hour, its shortfall against Ether had widened from 3.25 to 5.78 percentage points.
More than half of the final gap was already in place before that hour. That distinction matters if you saw the morning drop first and wondered whether it explained the whole day. The hour intensified an existing divergence. The next few hours included a fresh sampled low and a bounce, with UNI still 5.73 percentage points behind Ether at the matched 24-hour cutoff.
How the gap opened
Coinbase’s weekly UNI dollar history shows UNI at $6.9804 at 10:30 UTC on November 10. Its weekly Ether dollar history puts ETH at $2,091.77 at the same timestamp. Using those two values as separate starting points makes the relative declines comparable despite the difference in dollar price per token.
By 05:55 UTC on November 11, UNI was at $6.67485 in the five-minute UNI dollar history. Ether was at $2,068.24 in the five-minute Ether dollar history. That put UNI down 4.38% from the prior morning and ETH down 1.12%. Subtract the two unrounded returns and the gap was already 3.25 percentage points.
At 06:55 UTC, UNI was at $6.44645 and ETH at $2,052.72. Measured against their prices at 05:55, UNI lost 3.42% in that hour and Ether lost 0.75%. Measured from the previous day’s 10:30 prices, the cumulative declines had reached 7.65% and 1.87%. On that common starting basis, the gap widened by 2.53 percentage points during the hour.
By the 10:30 UTC finish, UNI was at $6.4755 and Ether was at $2,060.235. The gap was 5.73 points. Dividing the pre-hour gap by that final gap shows that about 57% had formed by 05:55. Roughly 43% of the final gap was added from 05:55 onward. Those shares describe the timing of the observed price gap. They cannot identify which trades, announcements or sellers contributed to it.
Where the earlier gap came from
A checkpoint at 17:00 UTC on November 10 puts that 57% figure in context. UNI was then at $6.6916, down 4.14% from the opening observation, while Ether was at $2,016.135, down 3.62%. That left only about half a percentage point between the two cumulative returns. The first part of the matched day therefore looked much closer across the two assets than the full day did.
From 17:00 to 05:55, Ether climbed 2.58% as UNI slipped another 0.25%. That difference accounts for most of the gap visible just before the morning hour. Starting the comparison at 05:55 captures an hour in which both prices finished lower and UNI fell faster. The earlier window explains why the gap already existed even though both tokens declined during the later hour.
What the late bounce recovered
The price path after 06:55 included another leg down. The lowest UNI observation in the five-minute dollar series within the matched day was $6.3333 at 09:30 UTC. The token then rose 2.25% from that sample to 10:30. That is a meaningful move from the low, but on a different denominator from the 24-hour return.
In dollars per token, the distance from the previous morning’s $6.9804 to the 09:30 observation was $0.6471. The bounce recovered $0.1422 of that distance by 10:30, or about 22%. The recovery percentage uses the preceding dollar decline as its denominator. The 2.25% return uses the sampled low as its denominator. Both describe the same rebound and answer different questions.
Moving the daily cutoff half an hour earlier makes the decline look larger. In the same Coinbase histories, UNI was down 8.57% in the 24 hours to 10:00 UTC, while Ether was down 2.16%. The relative ordering survives that change in cutoff, and the earlier window makes the gap about 6.41 percentage points. A quote from either window needs its own endpoint. The result does not describe the calendar-day close or where either asset traded after the window.
What a second venue showed
Binance’s completed UNI spot bars and its ETH bars provide a separate comparison in USDT. The five-minute bars ending immediately before the 10:30 UTC checkpoints showed UNI move from 6.990 to 6.485 USDT, a 7.22% loss. Over those same bar-end markers, ETH moved from 2,094.68 to 2,062.46 USDT, a 1.54% loss. For the hour ending just before 06:55, the corresponding declines were 3.37% for UNI and 0.75% for ETH.
The two venues also agree on when most of the final gap had formed. The 05:55 Binance marks put UNI 3.22 percentage points behind Ether from the prior morning, versus 5.69 points by the end. The pre-hour gap was about 57% of the final Binance gap, close to the separate Coinbase result. The percentages were computed within each venue and quote currency. Combining the two prices in a single return would mix USD observations with USDT trades.
The Binance rolling ticker recorded about 56.3 million USDT of UNI spot quote volume and 238,172 trades when sampled just after 11:00 UTC. In a subsequent top-100 order-book snapshot, the best bid was 6.454 USDT and the best ask was 6.455 USDT, a spread of about 0.0155% of the midpoint. Displayed orders within 1% of that midpoint totaled roughly 725,000 USDT on the bid side and 312,000 on the ask side in the returned levels. Those are observations of activity and displayed liquidity on one pair. The later snapshot cannot show what depth was available during the selloff, and those quotes could change or be canceled.
What the price data can establish
Comparing UNI with Ether helps separate a token move from one reference point in the broader market. Ether itself fell during the morning hour. UNI’s larger decline shows the two traded differently over that interval, without identifying the reason for the difference. This comparison measures UNI token prices. It does not measure swaps through Uniswap pools, protocol fees, liquidity provider withdrawals or demand for the protocol’s services.
The Coinbase main daily endpoints come from the same weekly history for each asset. The 10:30 finish agrees with the five-minute history for both. The daily series supplies the intrahour observations, including the 09:30 sample; the weekly series does not have observations at 05:55 and 06:55. The histories disagree at some shared timestamps away from the points used for the calculations. The lowest observed UNI sample therefore describes this dataset’s cadence. A trade between samples, on another venue or against another currency could have printed at a different level.
For the daily moves, the calculation is the ending observation divided by the starting observation, minus one. For the one-hour moves, the starting observation is the price at 05:55. For the gap, both cumulative returns keep the November 10 10:30 baseline. That fixed baseline is why the 2.53-point widening is a different figure from the difference between the two standalone one-hour returns.
At the matched finish, the bounce had recovered about one-fifth of UNI’s sampled dollar decline. The earlier daily cutoff still leaves UNI behind Ether, and the same intrahour divergence appears in the separate Binance bars. Those checks support a conclusion about the period examined. They provide no basis for assuming that either the selloff or the rebound will continue.
Send a correction or source question about this article.
Related Posts
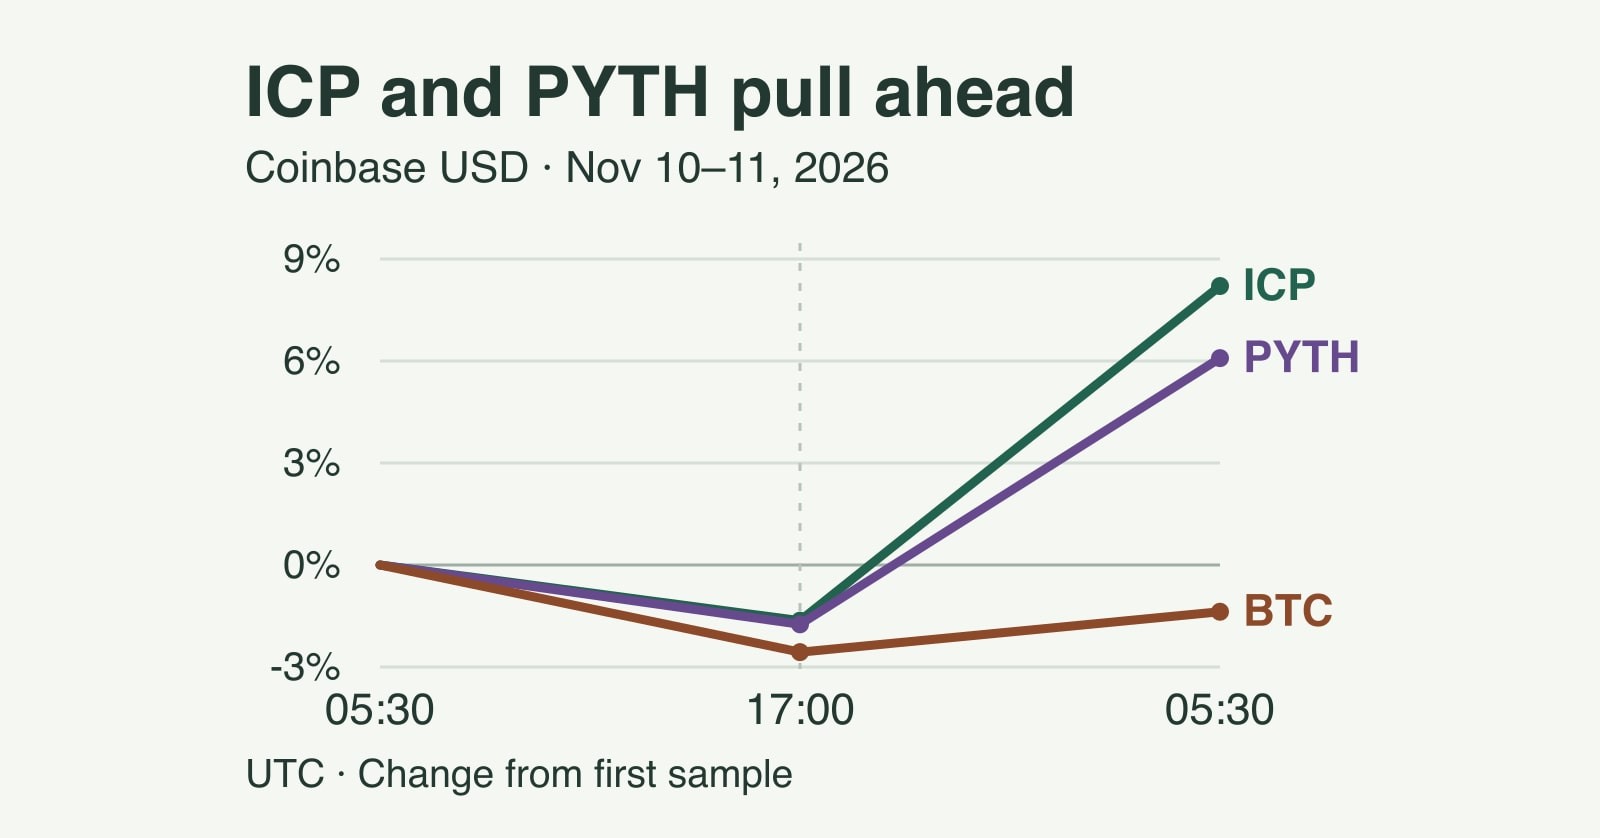
Internet Computer rises 8.2% as Pyth gains 6.1% and Bitcoin lags
ICP and PYTH fell alongside Bitcoin early in a matched 24-hour Coinbase dollar window. Their stronger recovery after 17:00 UTC put both back above their starting prices.
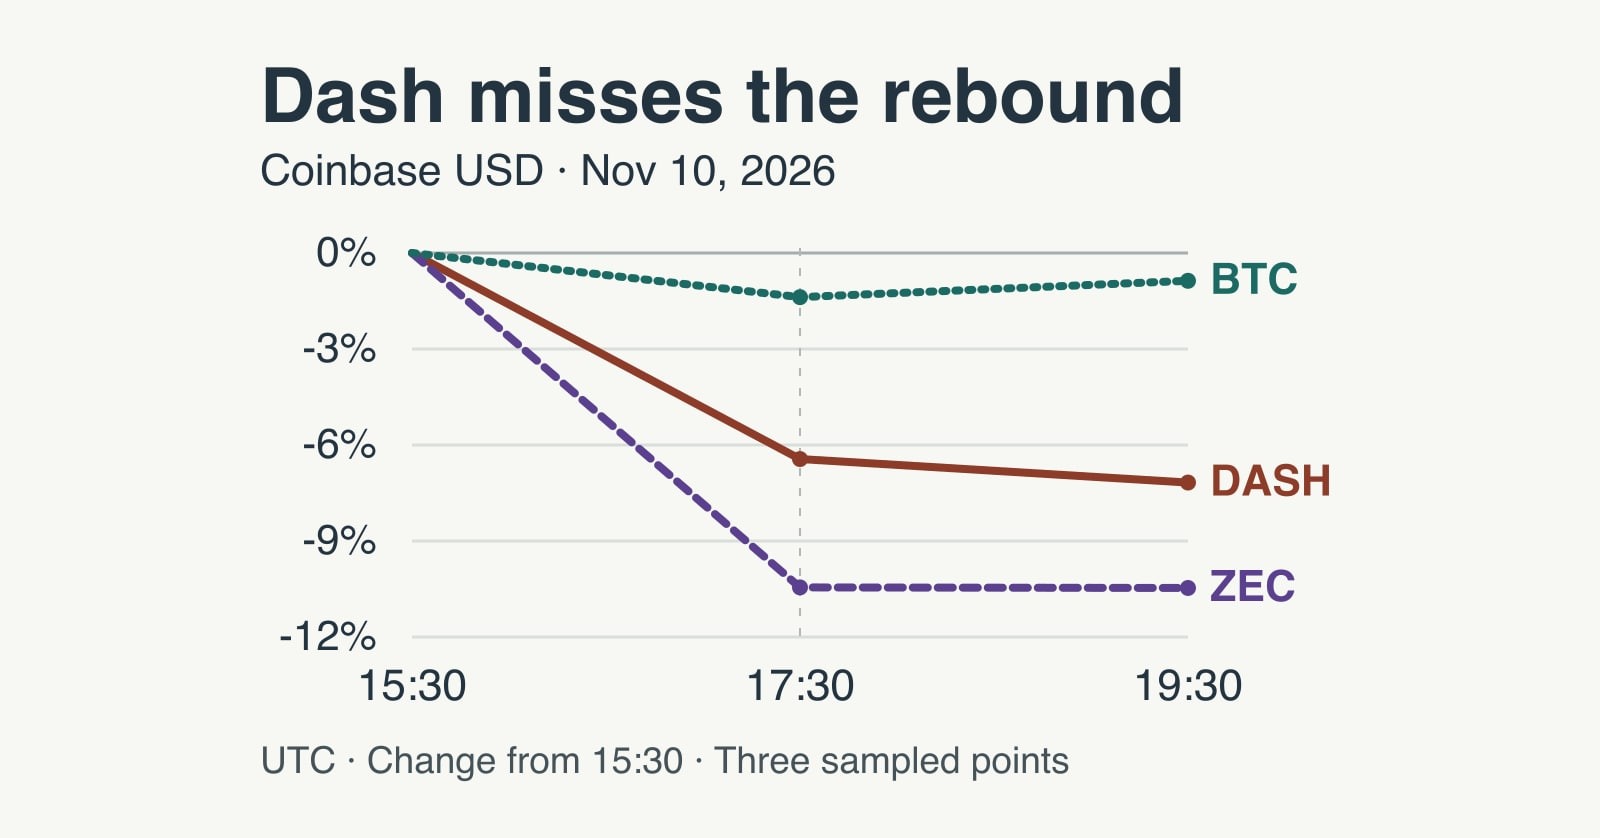
Dash falls 8.1% in 24 hours and misses Bitcoin’s late rebound
Dash fell 8.09% in a matched Coinbase dollar window. In the final two hours, Dash fell further while Bitcoin recovered and Zcash was nearly flat.
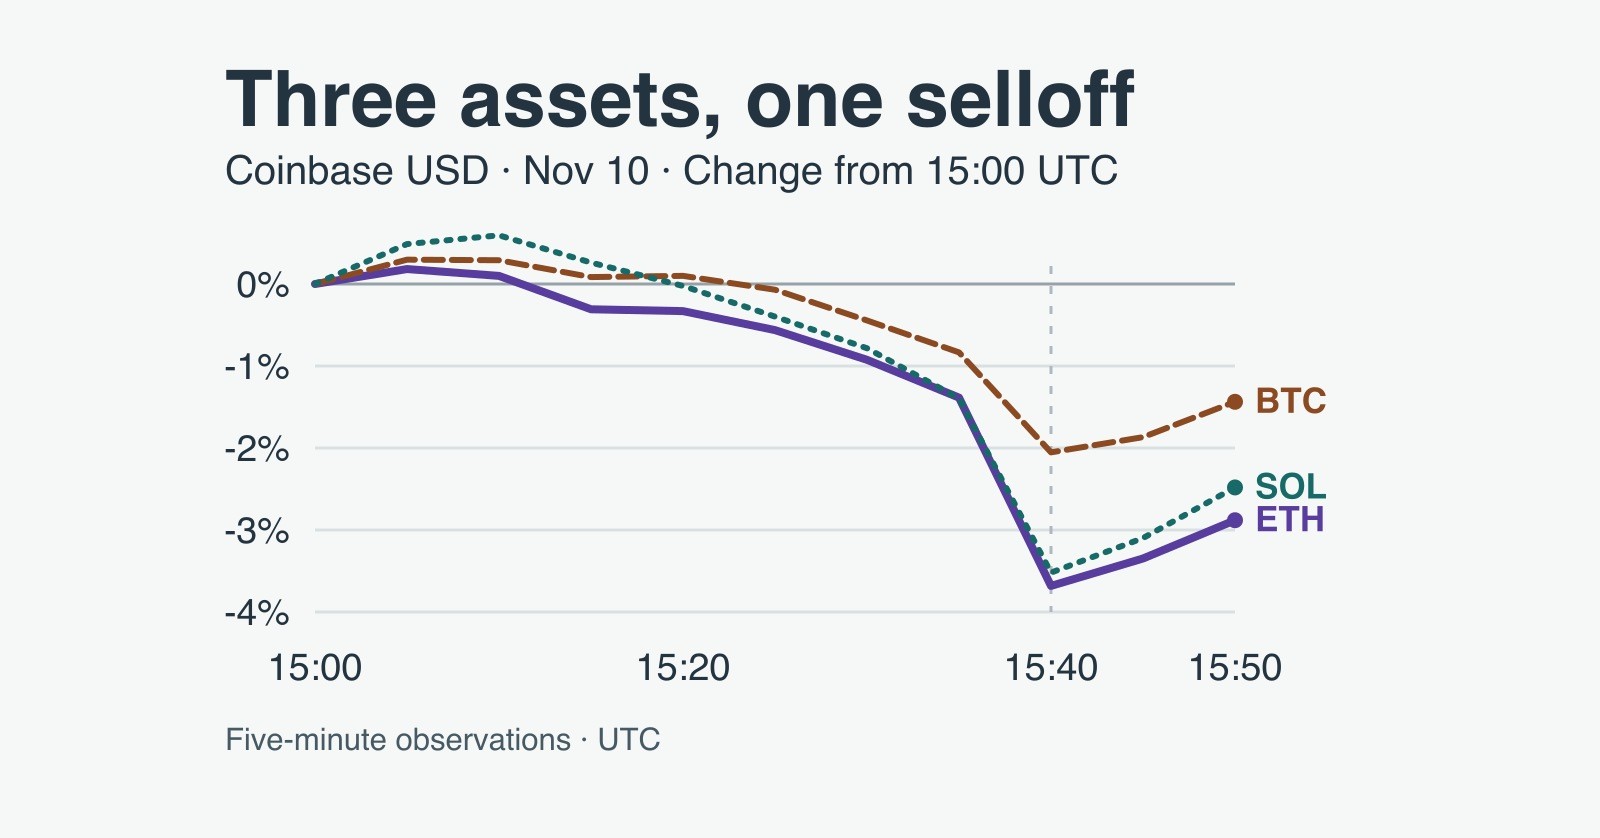
Ether falls 5.8% in 24 hours and comes within $4 of $2,000
Ether fell 5.77% in a matched 24-hour Coinbase dollar window. A five-minute comparison shows how its drop and partial rebound differed from Bitcoin and Solana.