Zcash falls 5.3% in 24 hours, with most of the drop in two hours
Coinbase dollar observations put ZEC at $1,153.87 after a 5.32% decline. Two hours explain most of the loss, while Bitcoin edged higher on the same clock.
Published
On this page
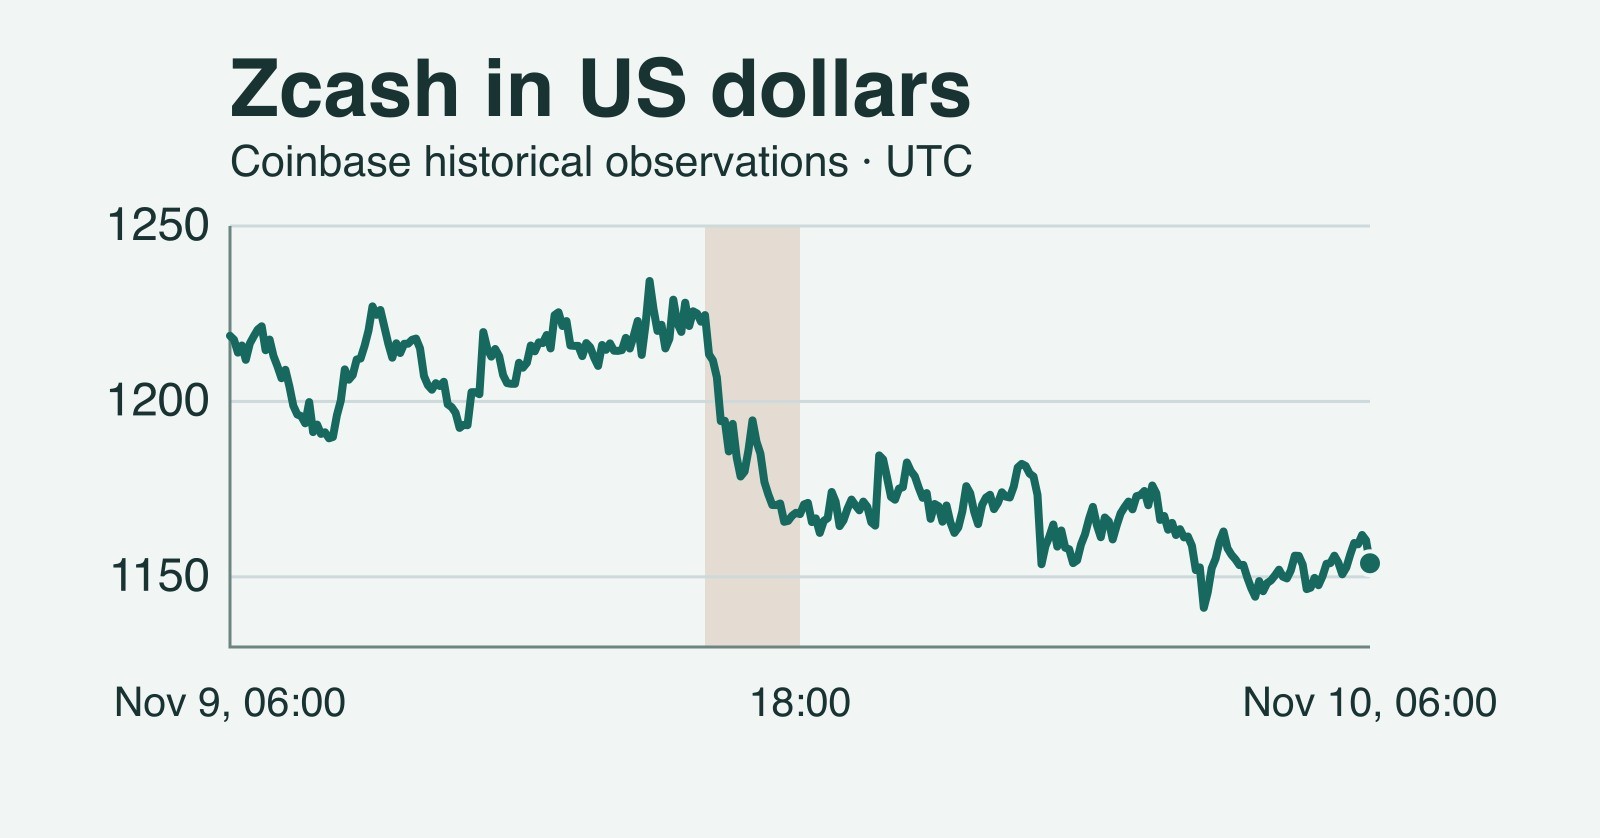
Zcash fell 5.32% to $1,153.87 in the 24 hours ending at 06:00 UTC on November 10, 2026, according to Coinbase historical price observations. A two-hour slide on November 9 accounted for about 87% of the net dollar loss. Bitcoin rose 0.46% over the same 24-hour interval.
The timing matters because Zcash was slightly higher than its opening observation before the sharp two-hour decline. It later dipped below $1,150, then came back above that level by the end of the window. The final hour showed a small gain even though the final five minutes erased part of it. Those different readings come from the same series and answer different questions about the decline.
The two hours that explain most of the move
The Coinbase weekly Zcash series recorded $1,218.705 per ZEC at 06:00 UTC on November 9. By 16:00 UTC, the intraday series showed $1,224.60, a gain of about $5.90 from the opening observation. At 18:00 UTC, it showed $1,167.885. The two-hour change was a loss of $56.715 per ZEC, or 4.63% from the 16:00 reading.
The full 24-hour change was a loss of $64.835 per ZEC. Dividing the two-hour loss of $56.715 by that net loss gives 87.48%. The comparison measures how much one interval contributed to the change between two fixed endpoints. It uses the net 24-hour loss as its denominator. The interval accounts for a smaller share if the comparison starts from the highest sampled price instead of the 06:00 observation.
The five-minute series put that high at $1,234.31 at 14:50 UTC on November 9. From there to the 06:00 reading the next day, Zcash lost $80.44, or 6.52%. The same $56.715 decline from 16:00 to 18:00 represents about 71% of that larger move. Both comparisons point to the same two hours, even though the choice of starting point changes the size of their contribution.
The path before 16:00 also helps explain why a single daily percentage can obscure what happened. An observer comparing only 06:00 and 16:00 would have seen a small gain. An observer who started at 16:00 would have missed the earlier swings and seen an immediate drop. The chart keeps both parts of the session visible and marks the interval used in the calculation.
A three-part reconciliation shows how the early gain offset part of the decline. From 06:00 to 16:00 UTC on November 9 the series gained $5.895 per ZEC. It then lost $56.715 through 18:00 and lost another $14.015 through 06:00 the next morning. Adding the three changes yields the $64.835 net loss. The two-hour portion and the later loss together exceed the net decline because the early gain partly offsets them.
The 18:00 reading also provides a way to separate the initial repricing from the later drift. It took two hours to fall from $1,224.60 to $1,167.885. The next 12 hours ended at $1,153.87, a further 1.20% decline measured from 18:00. That later interval included a dip to the sampled low and a partial recovery. Its smaller net change therefore understates the distance between some of the individual readings during those hours.
What happened around $1,150
The first regular five-minute observation below $1,150 in this 24-hour comparison came at 02:30 UTC on November 10, when the Coinbase series showed $1,141.18. It was also the lowest reading on the regular grid. The final reading at 06:00 UTC stood $12.69 above that low, a gain of about 1.11% from the trough.
The recovery across that level was uneven. Fourteen of the 73 five-minute observations from 00:00 to 06:00 UTC, counting both endpoints, were below $1,150. That count describes readings on the grid. It cannot tell us how many times the market traded through the level between observations or how long it spent on either side. The round number helps locate the price action on the chart. Whether it matters in later trading would require later evidence.
The last hour gives another example of how the baseline changes the result. Zcash rose 0.32% from $1,150.15 at 05:00 UTC to $1,153.87 at 06:00. Over the last 15 minutes, it fell 0.47% from $1,159.27. Over the last five minutes, it fell 0.57% from $1,160.445. The rebound from the sampled low had therefore survived at the cutoff, even as the final readings showed some of it slipping away.
Bitcoin moved in the other direction
Coinbase’s weekly Bitcoin series showed $74,371.365 at 06:00 UTC on November 9. Its intraday Bitcoin series showed $74,713.165 at 06:00 UTC on November 10. The increase was $341.80 per BTC, or 0.46%. The Zcash and Bitcoin percentages differed by about 5.78 percentage points across those matching timestamps.
That comparison makes a simple market explanation harder to sustain. Bitcoin and Zcash finished on opposite sides of their opening observations. That is evidence of a divergence between two assets in this window. A broad market claim would require a wider comparison, and an explanation for the Zcash move would need separate evidence about what drove orders or how liquidity changed while the price was falling.
CoinAbout has separately covered the Zcash draft to shorten the target block interval. A development proposal and a price series establish different facts. The Coinbase readings give the timing and size of the move. They do not identify who traded, how traders interpreted the proposal, or whether it influenced the price.
How the price window was measured
The calculation starts and ends at 06:00 UTC so both assets use the same clock. For each asset, CoinAbout used the weekly series for the November 9 starting observation and the intraday series for the November 10 endpoint. Each percentage is the end price minus the start price, divided by the start price. The underlying quotes are kept at their reported precision for arithmetic. The headline and opening summary use rounded figures.
The Zcash chart combines the first observation with 288 regularly spaced intraday readings, for 289 points. CoinAbout checked the overlapping timestamps before joining the sources. All 43 shared Zcash observations agreed at the reported precision. Bitcoin had one disagreement between its two histories among 43 overlapping timestamps. That point was inside the window, outside the two endpoints used for the Bitcoin return, and was excluded from the comparison.
These are historical Coinbase dollar price observations. The sampled high and low may differ from an exchange’s trade-by-trade extremes or the high and low reported for a calendar day. The 24-hour return here uses two specific observations 24 hours apart. A rolling price display can use a different endpoint, and a candle can show a different result if its interval ends earlier or later.
The windows also respond differently when an observation drops out. The last five minutes lost $6.575 per ZEC, a larger dollar decline than the $5.40 loss over 15 minutes. The readings show how that can happen. Zcash rose by $1.175 between 05:45 and 05:55 UTC before giving up that gain and more by 06:00. A single label such as “rebounding” would miss that distinction between the one-hour move and the sequence inside it.
At the cutoff, Zcash was still $64.835 below its price a day earlier and $12.69 above the sampled low. A later matched window could show the decline narrowing or extending. That would be a new observation, especially if the older drop had rolled out of the 24-hour comparison by then. The two-hour breakdown is a record of when this particular move happened, with the observation times fixed so the result can be checked later.
Send a correction or source question about this article.
Tags
Related Posts
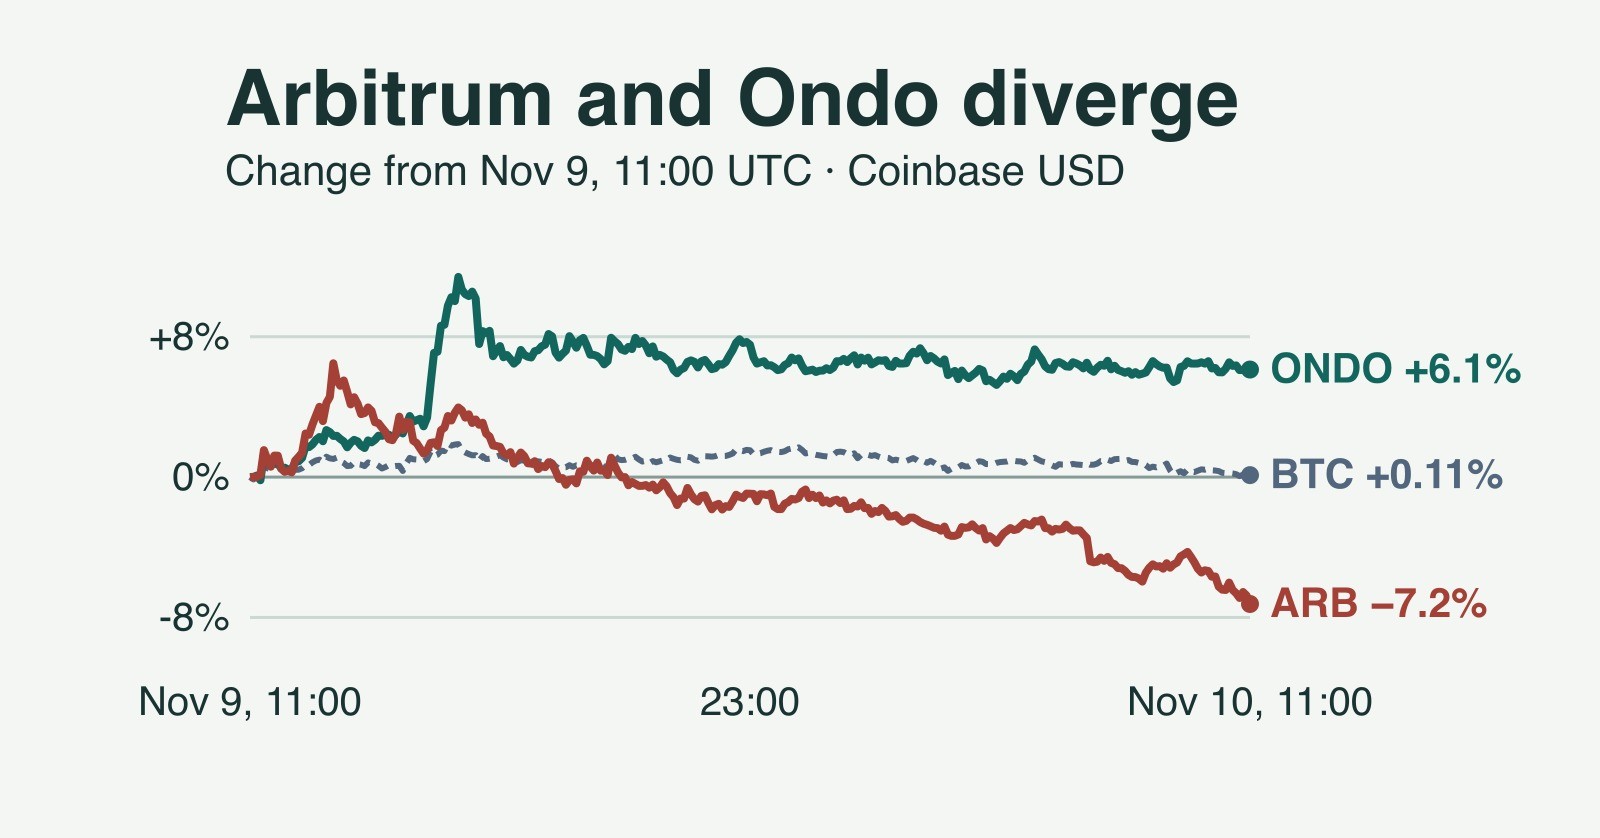
Arbitrum falls 7.2% while Ondo rises 6.1% in the same 24 hours
Arbitrum fell 7.23% and Ondo rose 6.13% in the same Coinbase dollar window. A five-minute timeline shows how the 13.36-point gap opened.
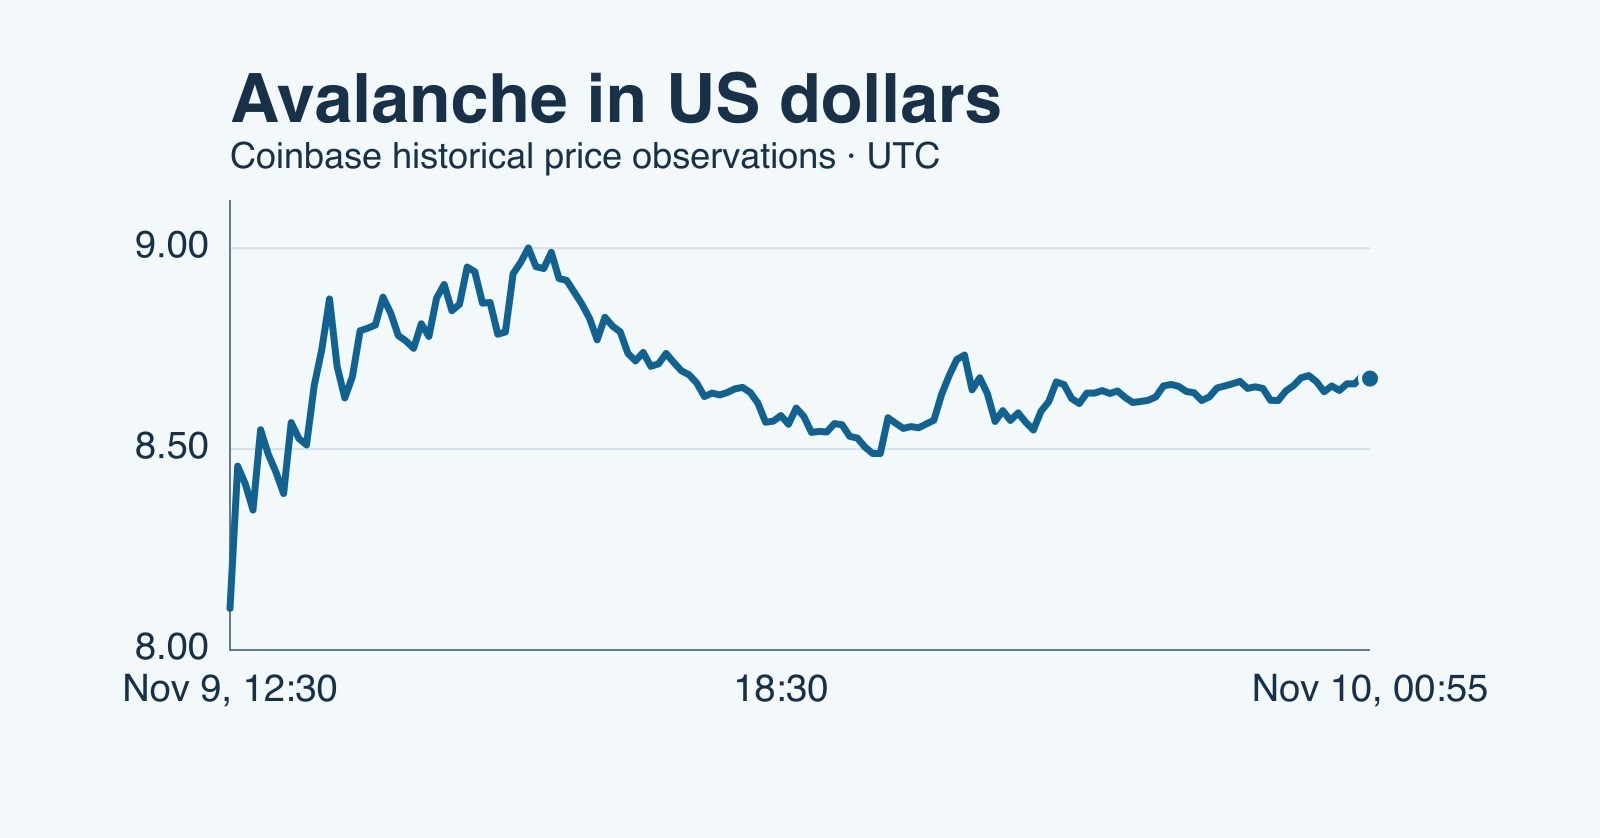
Avalanche rises 9% in 24 hours and keeps most of its rally
AVAX gained 9.07% in a matched 24-hour dollar window. Five-minute data show how much of the November 9 surge held after the price briefly touched $9.

Bitcoin dips below $77,000; rebound recovers 29% of sampled decline
Coinbase’s sampled BTC-USD price fell 6.80% from its October 29 high. A rebound to $77,933.80 recovered only 29% of that drop; our timeline separates the measurements.